How to Use the Graph Function
This monitor has a function to display the stored measurement results as a graph. If you measure your blood pressure in a certain time frame for three times a day in the morning, daytime, and evening, you will learn the trending of your blood pressure values and pulse rate in a week at a glance.
One of the measurement results in each time frame of morning, daytime, and evening is displayed in the graph.
Morning data: The last measurement made between 12 A.M. and 9:59 A.M.
Daytime data: The last measurement made between 10 A.M and 5:59 P.M.
Evening data: The last measurement made between 6 P.M. and 11:59 P.M.
•If you measure three times in the morning time zone, only the third measurement values are displayed in the graph.
•If no measured value exists in a time frame, a blank column is displayed.
There are three types of graphical displays.
All data graph: Displays all the data for morning, daytime, and evening in a week.
Morning data graph: Displays the morning data in a week.
Evening data graph: Displays the evening data in a week.
• No graph display is provided for showing only daytime data.
To display the graph
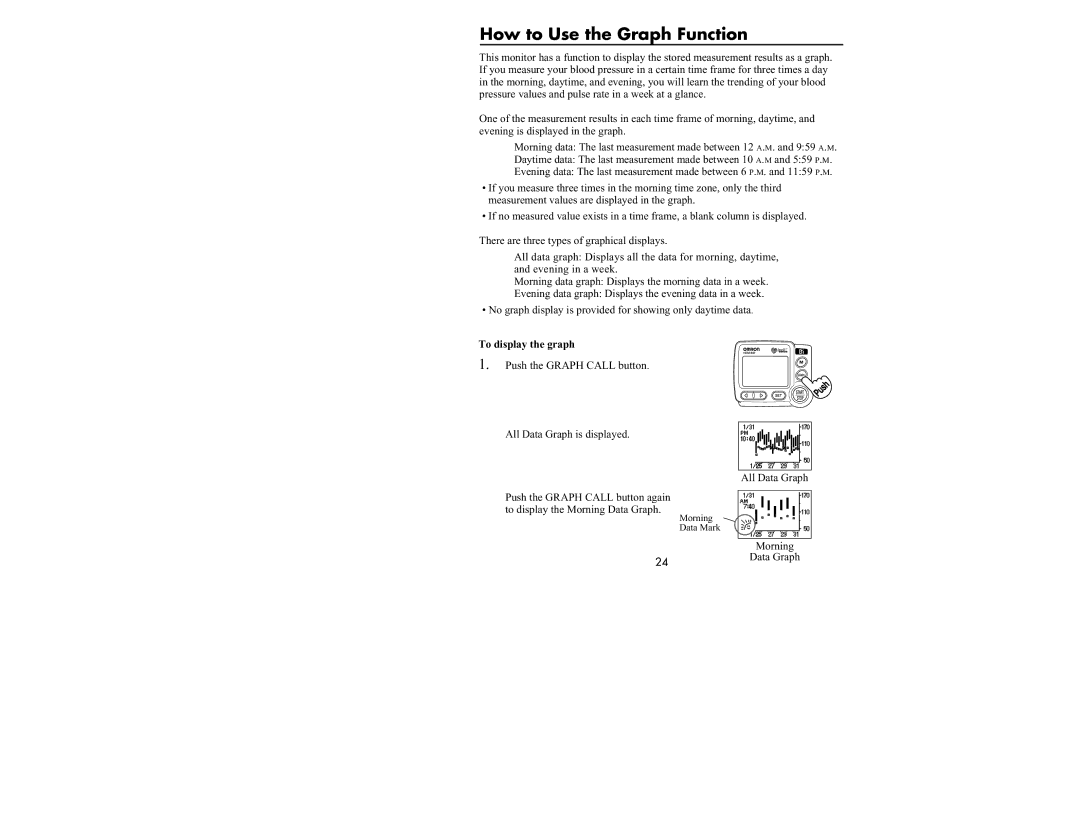
1. Push the GRAPH CALL button.
All Data Graph is displayed.
All Data Graph
Push the GRAPH CALL button again to display the Morning Data Graph.
Morning
Data Mark
Morning
24Data Graph