How to Use the Graph Function Continued
Push the GRAPH button again to display the Evening Data Graph.
•Each time you push the GRAPH button,
All, Morning, and Evening data are displayed in that order repeatedly.
Night ![]()
Data
Mark
Night Data Graph
2.Push the START/STOP button to turn off the power.
How to see the graph | Date of |
| Blood Pressure Values | |
How to see the graph is explained by using the | Measurement | (systolic/diastolic) | ||
|
| (mmHg) |
| |
example of All Data Graph. |
|
|
|
|
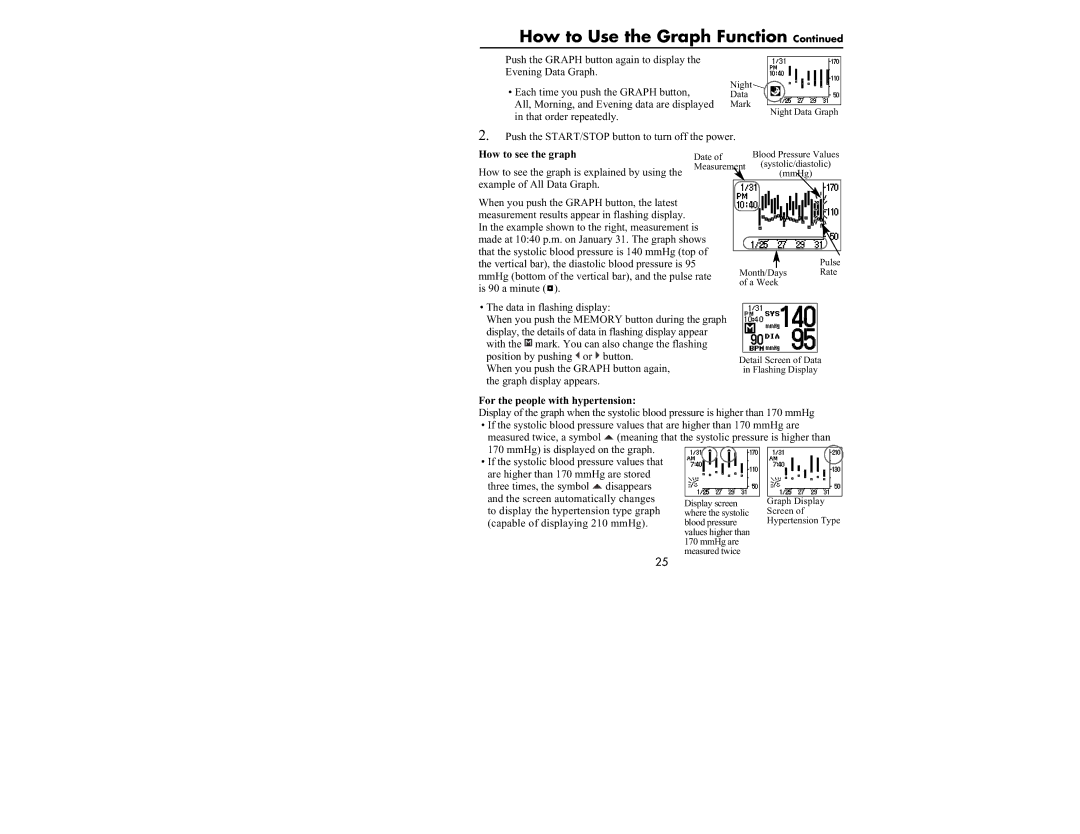
When you push the GRAPH button, the latest |
|
|
|
|
measurement results appear in flashing display. |
|
|
|
|
In the example shown to the right, measurement is |
|
|
| |
made at 10:40 p.m. on January 31. The graph shows |
|
|
| |
that the systolic blood pressure is 140 mmHg (top of |
|
| Pulse | |
the vertical bar), the diastolic blood pressure is 95 |
|
| ||
mmHg (bottom of the vertical bar), and the pulse rate | Month/Days | Rate | ||
of a Week |
| |||
is 90 a minute ( ). |
|
| ||
|
|
|
| |
•The data in flashing display:
When you push the MEMORY button during the graph display, the details of data in flashing display appear with the ![]()
![]()
![]()
![]()
![]()
![]() mark. You can also change the flashing position by pushing or button.
mark. You can also change the flashing position by pushing or button.
When you push the GRAPH button again, the graph display appears.
Detail Screen of Data in Flashing Display
For the people with hypertension:
Display of the graph when the systolic blood pressure is higher than 170 mmHg
• If the systolic blood pressure values that are higher than 170 mmHg are
measured twice, a symbol | (meaning that the systolic pressure is higher than | ||||||||||||||||||||||||||||||||||||||||||||
170 mmHg) is displayed on the graph. |
|
|
|
|
|
|
|
|
|
|
|
|
|
|
|
|
|
|
|
|
|
|
|
|
|
|
|
|
|
|
|
|
|
|
|
|
|
|
|
|
|
| |||
|
|
|
|
|
|
|
|
|
|
|
|
|
|
|
|
|
|
|
|
|
|
|
|
|
|
|
|
|
|
|
|
|
|
|
|
|
|
|
|
|
| ||||
• If the systolic blood pressure values that |
|
|
|
|
|
|
|
|
|
|
|
|
|
|
|
|
|
|
|
|
|
|
|
|
|
|
|
|
|
|
|
|
|
|
|
|
|
|
|
|
|
| |||
are higher than 170 mmHg are stored |
|
|
|
|
|
|
|
|
|
|
|
|
|
|
|
|
|
|
|
|
|
|
|
|
|
|
|
|
|
|
|
|
|
|
|
|
|
| |||||||
three times, the symbol | disappears |
|
|
|
|
|
|
|
|
|
|
|
|
|
|
|
|
|
|
|
|
|
|
|
|
|
|
|
|
|
|
|
| ||||||||||||
|
|
|
|
|
|
|
|
|
|
|
|
|
|
|
|
|
|
|
|
|
|
|
|
|
|
|
|
|
|
|
|
|
|
|
| ||||||||||
and the screen automatically changes to display the hypertension type graph (capable of displaying 210 mmHg).
25