Manuals
/
Siemens
/
Household Appliance
/
Water System
Siemens
pa module p03-01
manual
Theory, Hierarchy Of Flow Diagrams, Multi purpose plant, Curves
Models:
pa module p03-01
1
4
42
42
Download
42 pages
52.97 Kb
1
2
3
4
5
6
7
8
Hierarchy Of Flow Diagrams
Updates
Page 4
Image 4
Page 3
Page 5
Page 4
Image 4
Page 3
Page 5
Contents
Industry Sector, IA&DT
for Integrated Automation Solutions Totally Integrated Automation TIA
SCE Training Curriculum
PA Module P03-01
Matching SCE Trainer Packages for these curriculums
Continued education
Additional information relating to SCE
Note on Usage
THEORY IN BRIEF
TRAINING OBJECTIVE
ADVANCED LAYOUT OF UIS
HIERARCHY OF FLOW DIAGRAMS
THEORY
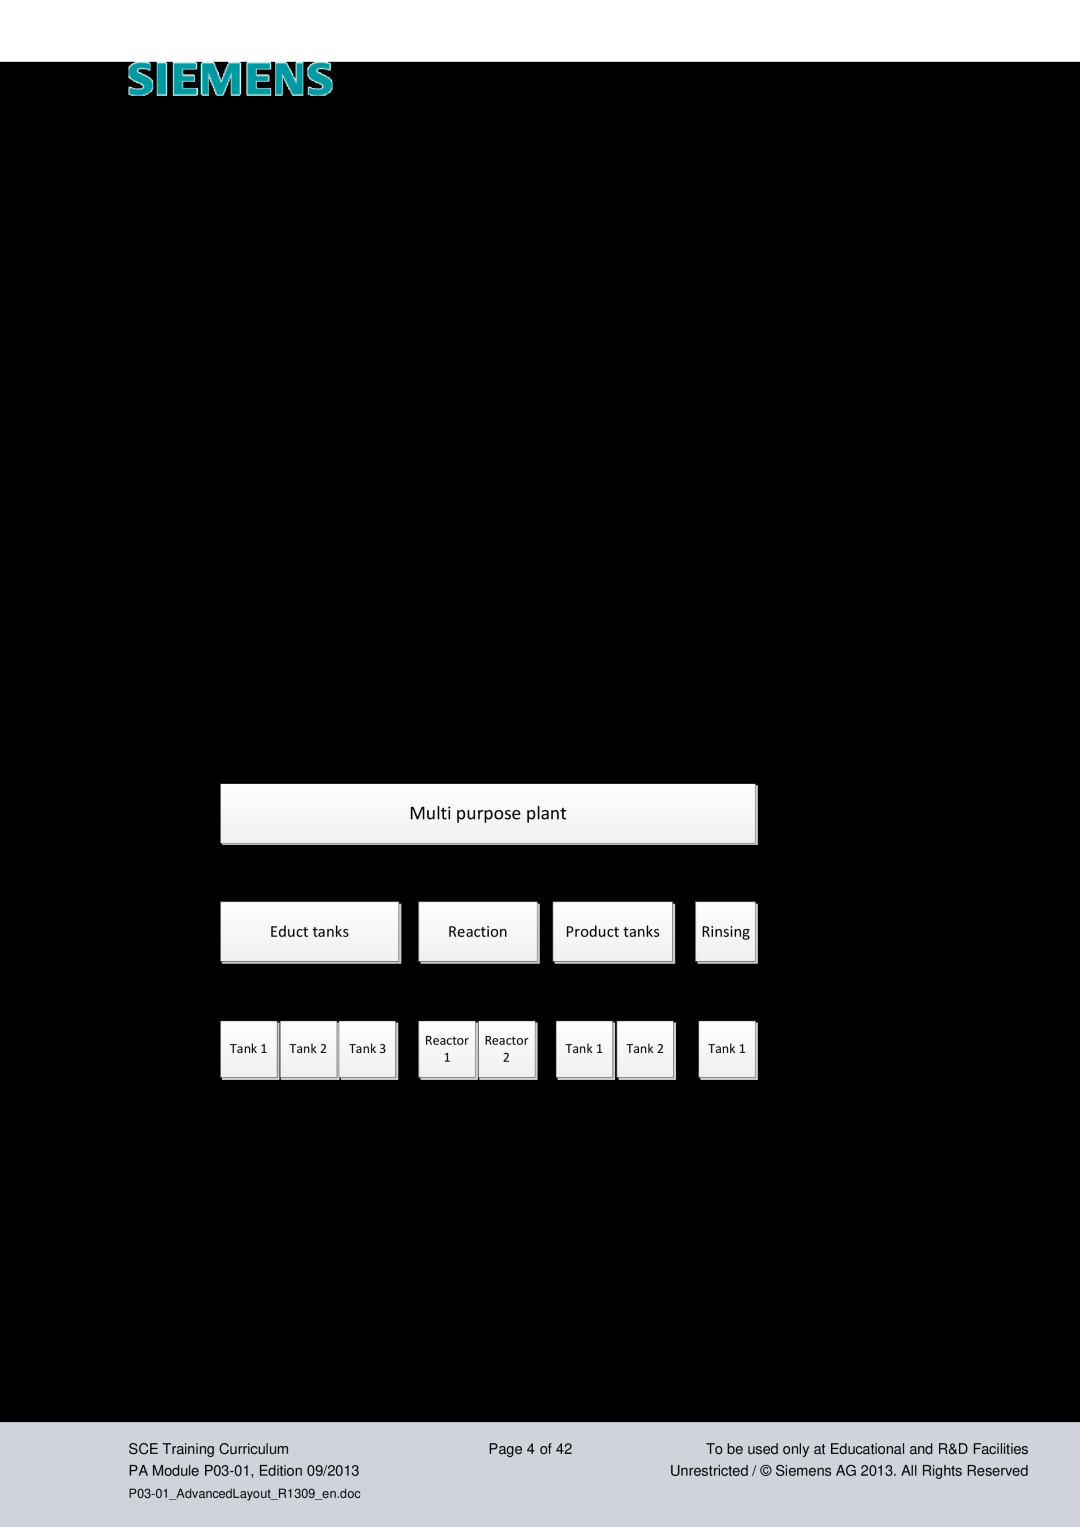
Multi purpose plant
CURVES
The Purpose of Curves
Acquisition and Storage of Curve Values
Designing Curve Displays
Updates
Prehistory
Primary Task
Commissioning
Process Control
or Analysis
ACTIVEX CONTROLS
Working area
LITERATURE
USER DEFINED OBJECTS
STEP BY STEP INSTRUCTIONS
TASK
TRAINING OBJECTIVE
PROGRAMMING
2. Then, adapt the settings of the plant hierarchy to the expansion. → Tools → Plant Hierarchy → Settings
4. Then, the block icons have to be generated in the new picture
Page 13 of
7. Now, once more activate in the ‘Plant View’ Compile and Download Objects. → SCEPCS7Prj → PLC → Compile and Download Objects
9. Now, in the ‘Component view’, start WinCC by highlighting and opening ‘OS1’. → OS1 → Open Object
11. Now, in the Object Properties, first change the geometry corresponding to your resolution for example, 1024x616 at 1024X768 and the background colors to ‘white’. For the color setting to be accepted, the static in the global color scheme has to be switched to ‘No‘. → Object Properties → Colors → Background color → white → Effects → Global Color scheme → No
12. Next, from the project library, drag in the face plate for reactor R001. → View → Library → Project Library → ReactorV10
Page 18 of
value 1000 → Minimum value 0→
17. Now, the display is positioned exactly over the reactor and some levels are moved to the back Arrange → Within the level → One to back for the stirrer, the heater and the labeling to be visible again then open the Properties for additional adaptations. → Properties
19. Then, select ‘Axis‘. Here, set the attribute ‘Scale‘ to ‘No‘
21. In the object palette, under the tab ‘Control‘ select the WinCC AlarmControl. Then draw a rectangle with the mouse. → Object palette → Controls → WinCC AlarmControl
selection by adding message blocks with the buttons message blocks
→ Online configuration → Online configuration Do not retain → OK
27. Next, select from the object palette, under the tab ‘Control‘, the WinCC OnlineTrendControl. Then, draw a rectangle with the mouse to position the window for the curve view. → Object palette→ Controls → WinCC OnlineTrendControl
Page 26 of
Page 27 of
Page 28 of
Page 29 of
Page 30 of
1000 ml. → Value axes → Object name Value axis Temperature → Label C →
value Value axis Manipulated variable → Level Value axis Level → OK
‘ReactorR001’
38. Then, highlight all objects and right click on the selection. Now, select ‘Create customized object‘. → Customized object → Create
→ StaticText2 Text → OK
44. Next, change the name of the user defined object in the library to
click on‘’ for ‘Dynamic’ and then select the tag. → → Tag
A1multipurposeplant/ T2reaction/reactorR001/ A1T2L001/ A1T2L001/ MonitorA1T2L001/PV#Value → OK
49. Finally, we should position the faceplates picture blocks correctly, label and save them
→ → Project Library → customObjectreactorV10
53. In the properties you can now access, under ‘UserDefined’, the selected properties of the customObject. Thus, you created an object with a specific selection of properties that can be used again and again quickly and effectively. → Properties → Object Properties → UserDefined
EXERCISES
TASKS
Top
Page
Image
Contents