Edit | Zoom | Options, |
|
| Hide Sequence |
|
| Marker |
|
| 9Show Sequence Marker |
|
| Shown on page 23. |
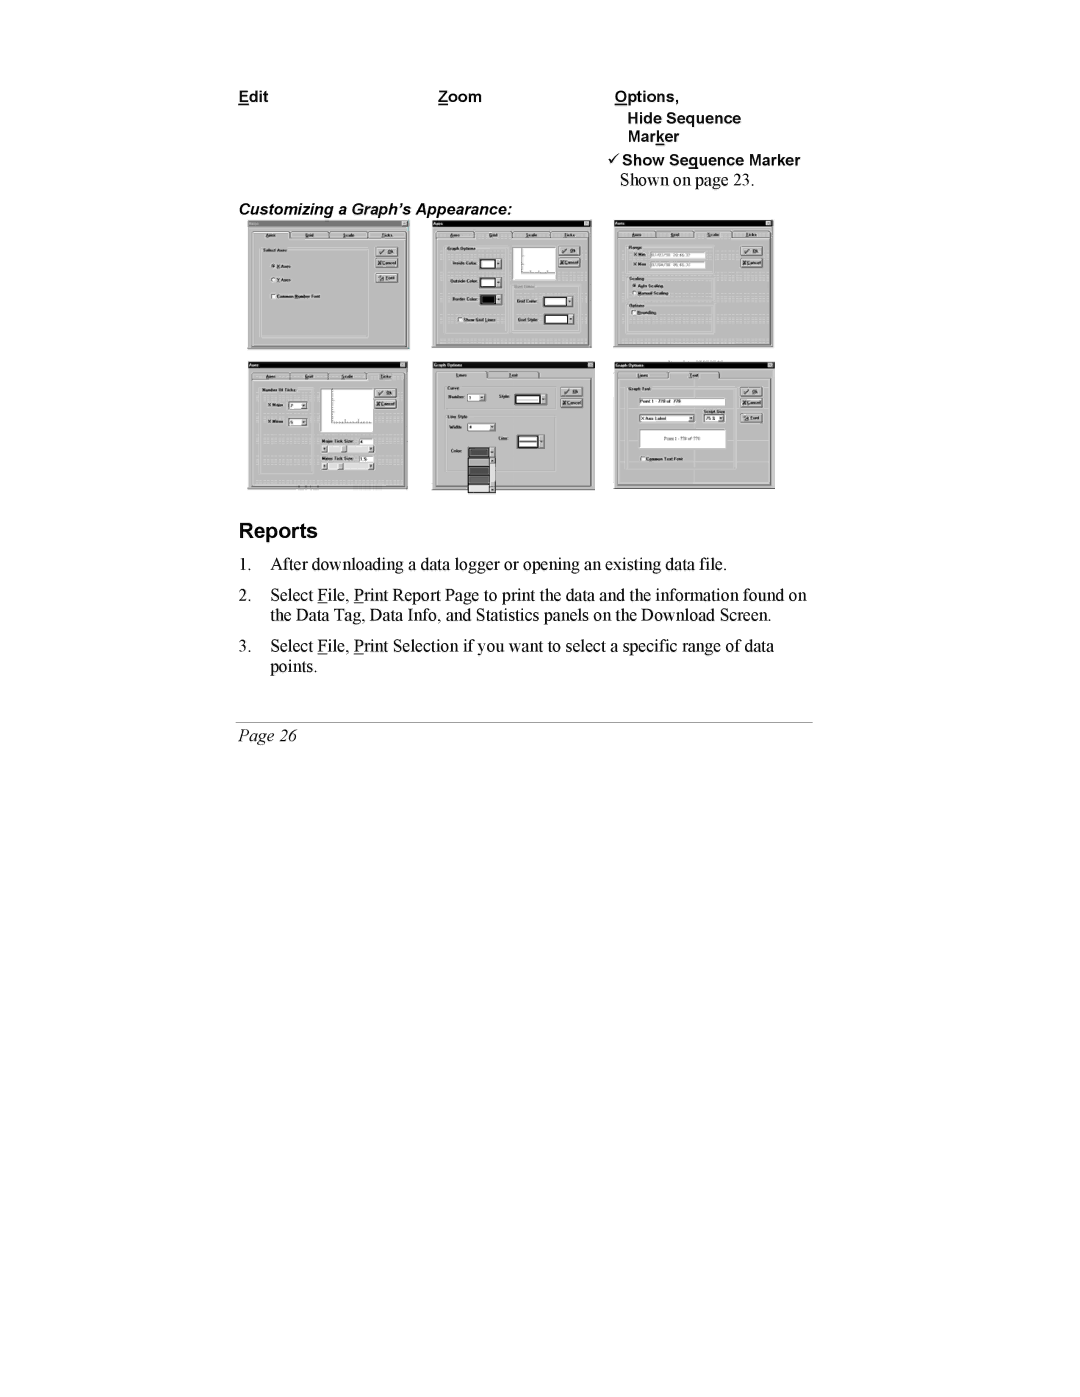
Customizing a Graph’s Appearance:
Reports
1.After downloading a data logger or opening an existing data file.
2.Select File, Print Report Page to print the data and the information found on the Data Tag, Data Info, and Statistics panels on the Download Screen.
3.Select File, Print Selection if you want to select a specific range of data points.
Page 26
