APPENDIX A: SPECIFICATIONS
Table
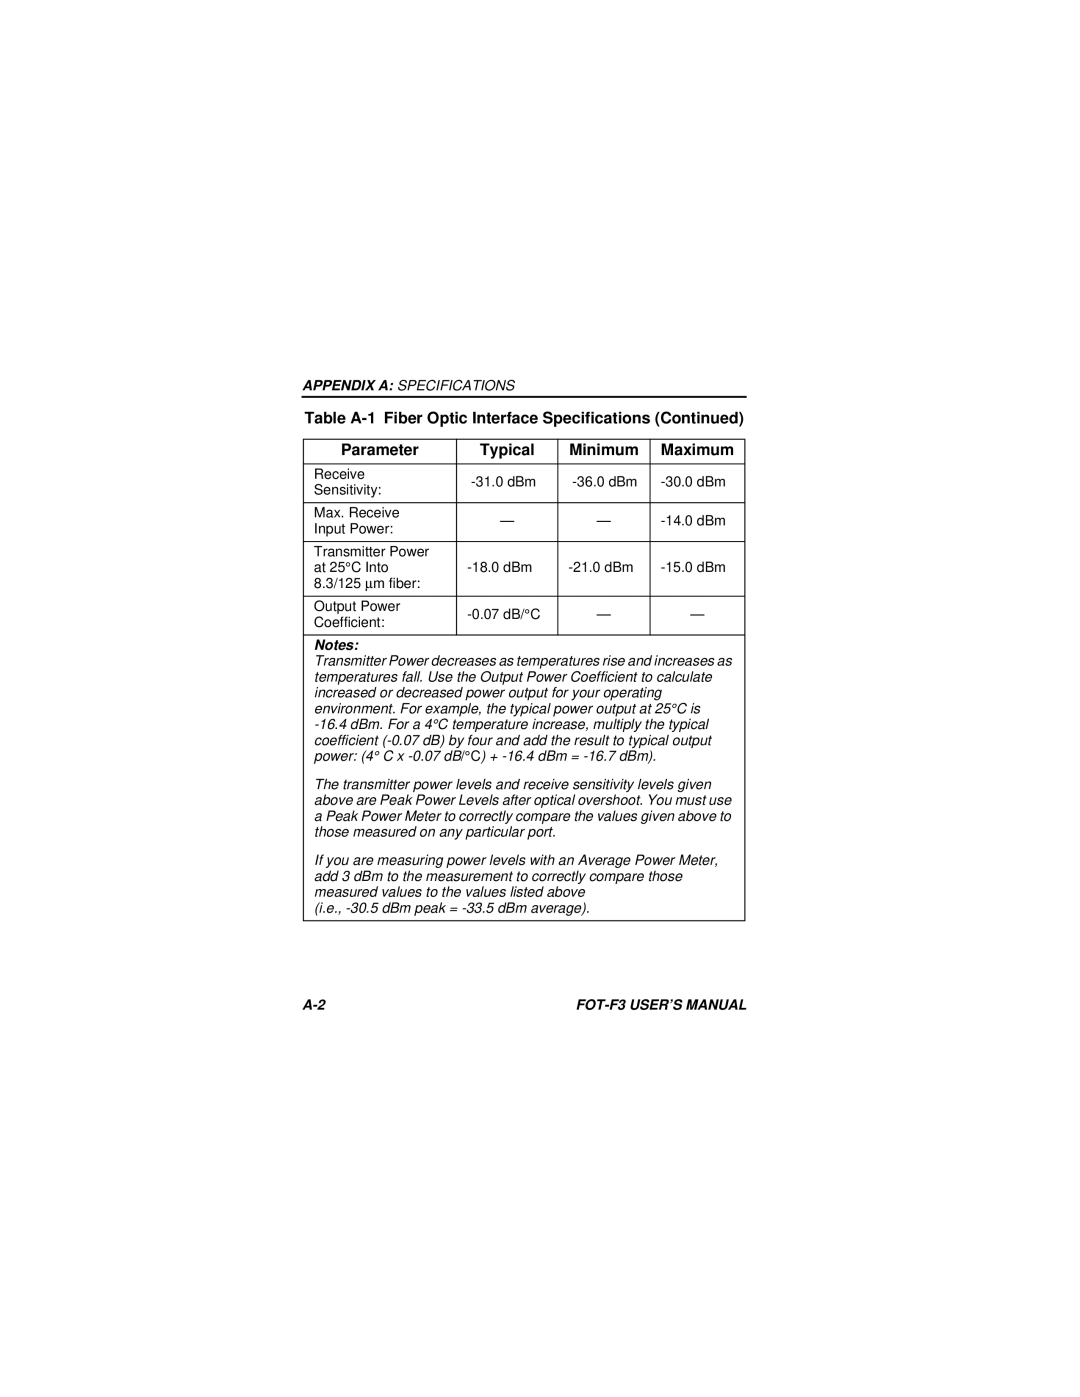
Parameter | Typical | Minimum |
| Maximum | |
|
|
|
|
| |
Receive |
| ||||
Sensitivity: |
| ||||
|
|
|
| ||
|
|
|
|
| |
Max. Receive | — | — | |||
Input Power: | |||||
|
|
|
| ||
|
|
|
|
| |
Transmitter Power |
|
|
|
| |
at 25°C Into |
| ||||
8.3/125 ∝m fiber: |
|
|
|
| |
|
|
|
|
| |
Output Power | — |
| — | ||
Coefficient: |
| ||||
|
|
|
| ||
|
|
|
|
| |
Notes:
Transmitter Power decreases as temperatures rise and increases as temperatures fall. Use the Output Power Coefficient to calculate increased or decreased power output for your operating environment. For example, the typical power output at 25°C is
The transmitter power levels and receive sensitivity levels given above are Peak Power Levels after optical overshoot. You must use a Peak Power Meter to correctly compare the values given above to those measured on any particular port.
If you are measuring power levels with an Average Power Meter, add 3 dBm to the measurement to correctly compare those measured values to the values listed above
(i.e.,