Page
Page
Virus Disclaimer
Restricted Rights Notice
Contents
Chapter Status and Configuration
Chapter Configuring the Trap Table
Chapter
Chapter IP Interface Configuration
Chapter SNA Status and Configuration
Chapter BSC Interactive Configuration
Chapter Bridge Configuration
Chapter SmartSwitch Voice Configuration
Appendix a FRX4000, FRX6000, and SmartSwitch MIB Components
IPX Interface Configuration
Chapter
Using this Guide
Using this Guide
What’s not in the FRX User’s Guide
Conventions
Screen Displays
Button
Using the Mouse
Getting Help
Year 2000 Compliance
FRX4000, FRX6000, and SmartSwitch 1800 Firmware
Using the Hub View
Using the FRX4000, FRX6000, and SmartSwitch 1800 Hub View
Navigating Through the Hub View
Using the FRX4000, FRX6000, and SmartSwitch 1800 Hub View
FRX4000, FRX6000 and the SmartSwitch 1800 Hub Views
Module and Port Color Codes
Port and Module Color Codes
Down
Mousing Around a Module Display
Using the Mouse in a Hub View Module
Location
Hub View Front Panel
Uptime
Name
IP Address
Clicking the Device button displays the Device menu, Figure
Monitoring Hub Performance
Device, Module, and Port Menus
Operation Status
Selecting a Port Display Form
Port State
Admin Status
Port Type
Yet
If Index
Connector Type
Speed
Max Packet Size
Configuring RLP Protocols
Viewing Device Information
Present in the hub
Change or add protocols for the selected RLP
Configuring Serial Port Protocols
Serial Port Information Window
Viewing Serial Port Information
Serial Port Pin Status
Using the FRX4000, FRX6000, and SmartSwitch 1800 Hub View
Viewing LAN Port Information
RLP Health
Viewing Statistics
Little differently in general, however, frames are rejected
Serial Port Health
LAN Card Health
Transmitted by the selected LAN interface, expressed as a
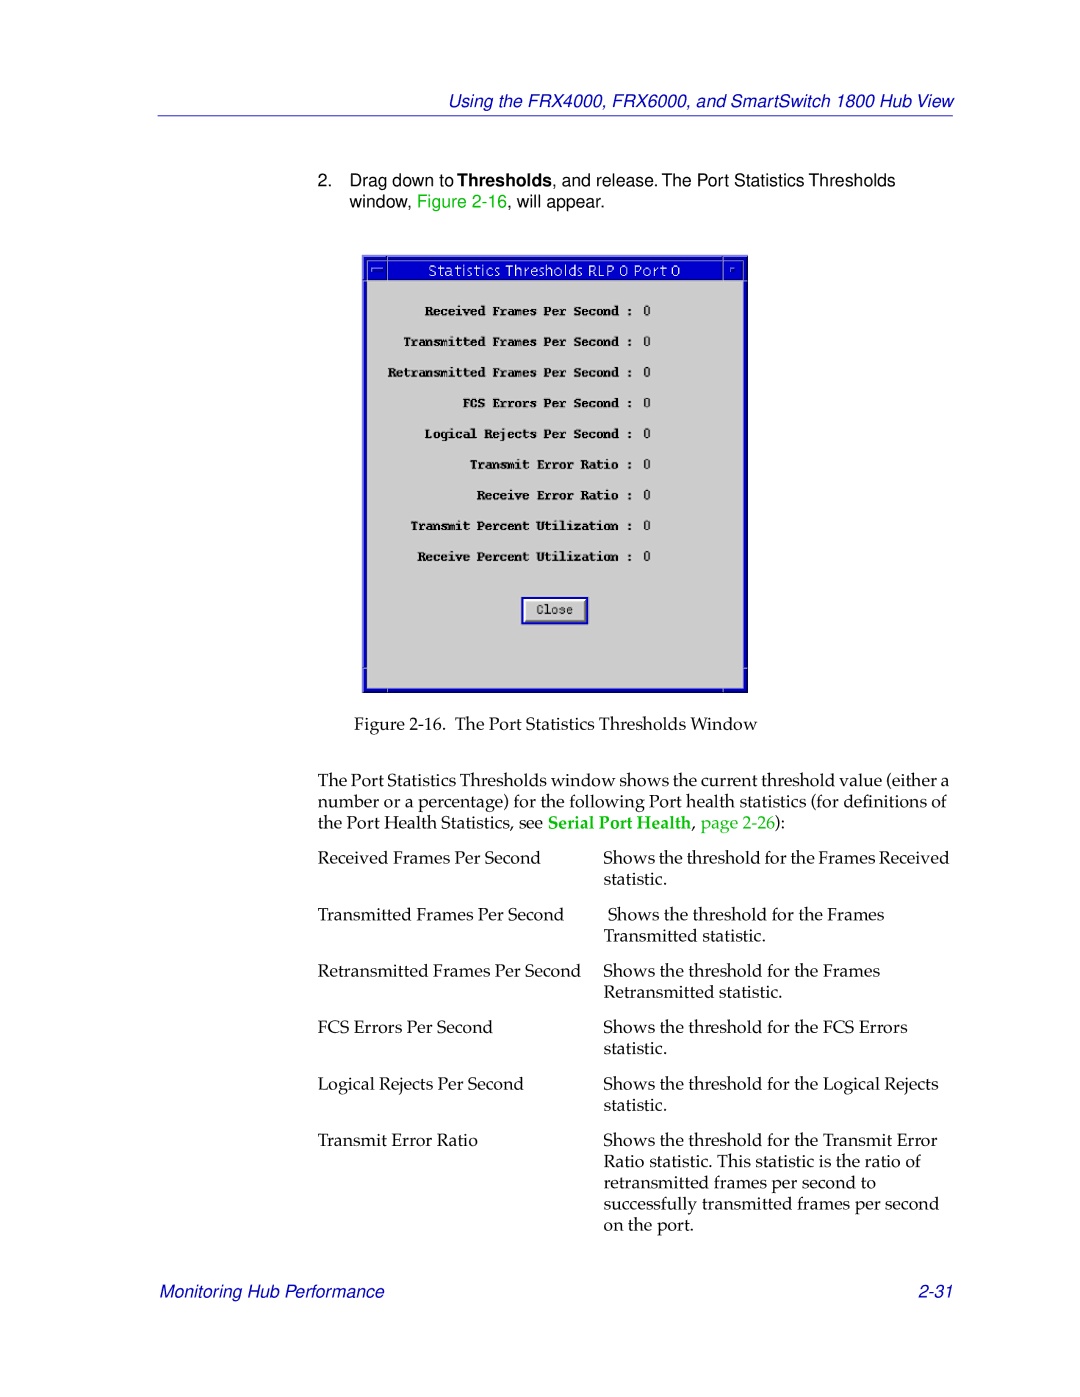
RLP Statistics Thresholds
Viewing Statistics Thresholds
Serial Port Statistics Thresholds
Using the FRX4000, FRX6000, and SmartSwitch 1800 Hub View
Managing the Hub
Setting the Polling Intervals
Port Operational State
Contact Status
Device General Status
Device Configuration
Applying Port-level Changes
Enabling and Disabling Serial Ports
Launching the Trap Table
About Traps
Severity
Status
Configuring Traps
Configured for normal sequence numbering
Trap Messages
Transmitter Stuck 146
LP Msg Queued exceeded T n C n 305
Illegal TC/Gen Clk Combination 219
Excessively noisy line 250
LP Buf Usage exceeded T n C n 304
RTrn Frm/Sec exceeded T n C n 313
LP Rej Frm/Sec exceeded T n C n 308
Rcv Frm/Sec exceeded T n C n 311
Tran Frm/Sec exceeded T n C n 312
Rcv Err Ratio exceeded T n C n 317
FCS Rej/Sec exceeded T n C n 314
Log Rej/Sec exceeded T n C n 315
Trn Err Ratio exceeded T n C n 316
LIC n Configured, Not Installed 378
Receive Yellow Alarm Condition Set 338
Receive Yellow Alarm Condition Set 339
LIC n Installed, Not Configured 377
Link Failed 404
Link Disabled 401
Link Disconnected 402
Link Up 403
Call Clr LCN = n cc = n dc = n 407
PVC Reset 410
Received Reset LCN = n, cc = n dc = n 411
Received Reset Confirm 412
PU Status p = n stn = 0xn status = n 426
End of Congestion, n events lost 415
PAD Autocall Retries Exhausted 416
Frame Relay Link Failed 417
Remote Control Released 433
File Update FRDLCI.DAT 429
Received Port Disable Request 430
Node Under Remote Control 432
RCV Unknown Event Code from Net 436
DOS Error Handler Exceeded Limit 438
Database Error, Access Restricted 439
Async Init File Upd ASYSETUP.DAT 441
Port Config File Upd PRTPAR.DAT 445
Default File Upd X25REC.DAT 452
Alarm Enable File Upd ERRMSG.TXT 453
Remote Update File Upd UPDATE.TXT 454
IP Interface File Upd IPRSUB.DAT 460
PAD Login File Upd PADLOG.DAT 458
CUG File Updated CUGPAR.DAT 461
IP Route File Upd IPRSUB.DAT 459
LP Rej Frm/Sec Under Threshold 468
LP Msg Queued Under Threshold 465
LP Rcv Frm/Sec Under Threshold 466
LP Trn Frm/Sec Under Threshold 467
Port Rcv Usage Under Threshold 478
Error adding interface n 483
Error modifying interface n 484
Rcv Err Ratio Under Threshold 477
IPX Route File Upd IPXRSUB.DAT 493
Error adding route with destination n, mask n, router n 490
491
BAG n capped at n but trunk Maxdps n 492
Bpad Invalid MSG n-Link 502
Alloc Error on Master Snmp Agent 494
Bpad Invalid Q Pkt n-PL 500
Bpad Invalid Pkt n-PL 501
Bsci Invalid state event action 518
Bsci Invalid port number or type 515
Bsci Invalid message transfer 516
Bsci Invalid circuit operations 517
Enter Service Affecting Condition 532
Dlci n Line does not exist 539
Dlci n No Response to Status ENQ 536
Dlci n Flow Control On 537
Dlci n Frame Discarded-Flow Ctl 538
Dlci n No Status ENQ Received 548
Dlci n frame relay PVC deleted 545
Dlci n frame relay PVC connected 546
Dlci n Data Received on Inactive PVC 547
Fr RLP/PORT/DLCI Mismatch 644
Receive Carrier Loss condition Cleared 654
Receive Remote Alarm condition Set 652
Receive Remote Alarm condition Cleared 655
Receive Loss of Sync condition Cleared 653
Sdlc Stn rcvd FRMR, Nr invalid 706
Sdlc Rem Stn sent Invalid Command 708
Sdlc Link Stn rcvd FRMR, Inv. cmd 704
Sdlc Stn rcvd FRMR, Ifld invalid 705
Sdlc Rem sent UA in NRM 718
Sdlc Station Inactivity time exp 712
Sdlc XID Retries exhausted 713
Sdlc Rem Tx Frame exceeds Maxdata 717
LLC/2 Frmr Rcvd, Invalid Nr 741
LLC/2 Sabme Received when open 738
LLC/2 Frmr Rcvd, Invalid Command 739
LLC/2 Frmr Rcvd, Ifld not permitted 740
LLC/2 Frmr Sent, Ifld not permitted 744
LLC/2 Frmr Rcvd, Invalid Command 743
Excessive Link CRC errors 759
Sdlc Transmit link error 761
Sdlc Link Stn rcv FRMR, Unexp. Ifld 762
About Subscriber IDs
Configuring the Subscriber Table
Subscriber Table Window
Accessing the Subscriber Table
Subscriber ID
Configuring the Subscriber Table
Redirect Out-of-Order
Algorithm
Systematic Redirect
Redirect Busy
Port
Configuring Routing Table Entries
Priority
Path
Address
Adding or Modifying Subscriber Table Entries
Configuring Address Table Entries
Index
Routing Table
Address Table
Deleting Table Entries
Frame Relay Status Configuration
Port Configuration
Configuring Frame Relay Ports
Line Speed
Max Bytes per Frame
N1 Polling Count
N2 Error Threshold
Maximum Supported VCs
T1 Link Integrity Timer
T2 Polling Verification Timer
N3 Monitored Events Count
Receive Clock from DTE
Blocked Flag
Logical DCE
Generate Clock
Bandwidth Allocation
Backup Use Only
Outgoing Rate Control
Applying Port-level Changes
Dlci Rate Configuration
Changing Configuration Values
CIR In/Out
Dlci
Be In/Out
BC In/Out
Changing Dlci Rate Values
Backup Group Number
Backup Protocol
State
Frame Relay Backup Groups
Configuring Frame Relay Backup Groups
Group
Wait Timer
Protocol Enabled
Changing Backup Group Values
Configuring Logical Ports
Dlci Number
Logical Port
Bandwidth Allocation Group
Default Packet Size
Closed User Group Member
Setup Packet Window Size
Default Throughput Class
Max UnACK Packets/Channel
Throughput Class Negotiation
Make Calls Outside CUG
Encapsulation Method
Flow Control Negotiation
Changing Configuration Values
Viewing Frame Relay Status
Anxd Transmitted and Received
Management Stats
LMI Transmitted and Received
DE Transmitted and Received
Congestion Stats
Frames Discarded
Errors
Becn Transmitted and Received
Fecn Transmitted and Received
Page
Status and Configuration
X.25 Physical Port ConÞguration
Configuring X.25 Physical Ports
Disconnect Timer
Inactivity Timer
Setup Timer
Closed User Group Index
Network Trunk Group
Dial In/Out
Flow Control Negotiation
Viewing X.25 Status
DM Transmitted/Received
Sabm Transmitted/Received
UA Transmitted/Received
Disc Transmitted/Received
RNR Transmitted/Received
Info Transmitted/Received
Rej Transmitted/Received
Frmr Transmitted/Received
Status and Configuration Viewing X.25 Status
SNA Status and Configuration
Sdlc Port Configuration
Configuring SNA Ports
Packet Size
MAX Retries
NRZ Data Encoding
PAD Type
Lpda Support
L1 Duplex
Disable Rqst Disconnect
Idle Fill Char
Sdlc PU Configuration
Local Subscriber Id
Lpda Resource Id
Auto Call Enabled
L2 Data Mode
Remote Subscriber Id
Changing Sdlc PU Subscriber Values
Sdlc PU LLC2 Configuration
Local MAC Address
Local SAP Address
T1-LLC2 Reply Timer
Ti-Inactivity Timer
Tw-Max Out LPDUs
T2-Rcv Ack Timer
N2-Max LPDUs
N3-Max Info LPDUs
Changing Sdlc PU LLC2 Values
Suppress XID
Sdlc Link Station ConÞguration window
Sdlc Link Station Configuration
Max Rx UnACK I-Frames
Reply Timeout
Max RX PDU Size
Max TX PDU Size
Group Poll Address
Data Mode
Retry Sequence Repeat Count
RNR Limit
Changing Sdlc Link Station Values
Configuring LLC2
Host Index
Traffic Group
Host MAC Address
Session Type
T2-Recv Ack Timer
T1-Reply Timer
N2-Expired T1 LPDUs
N3-LPDU Count
Tw-LPDUs Outstanding
Interface Number
Routing Subscriber ID
Source MAC Address Mask
Originated Connections Table
Configuring LLC2 Host Connections
Type
Sequence
Changing Host Connections
Viewing Sdlc Status
Sdlc Port Statistics
Frames Received and Transmitted
Invalid LS Addr
Dwarf Frames Received
Remote Re-Tx I-Frames
Protocol Errors
Inactivity Timeouts
Local Re-Tx I-Frames
Inactivity TOs
Sdlc Link Station General Statistics
Retries Exp
Sdlc Link Station Rx and Tx Statistics
UI-Frames
Poll
Poll Response
Frame
Retransmits
Octets
Configuring Bsci Ports
BSC Interactive Configuration
Max Frame Size
Start Sync Chars
No Response Timer
Retransmission Period
Max Retransmissions
Slow Poll Retry Count
Error Retransmit Count
NAK Retry Count
Multidrop
Full Duplex
End-to-End ACK
Answer Non Configured
Changing Bsci Port Configuration Values
Clear VC on Last Dev Down
Pad Packet Assembler/Disassembler Type
Bsci Subscriber Information
Bsci Subscriber ID Information
Auto Call
Retry Timer
Connection ID
Adding or Modifying Bsci Subscriber Information
Configuring Bsci Devices
Single User VC virtual circuit
Control Unit ID
Device Unit ID
Printer Attached
Adding or Modifying Bsci Device Information
Transparent Text Support
BSC Interactive Configuration Configuring Bsci Devices
IP Interface Configuration
Configuring IP Node Defaults
IP Interface Configuration
Configuring IP Interfaces
Interface Number
Route Metric Hops
IP Interface Type
Maximum Transmission Unit
Network Mask
Icmp Add Routes
RIP Delta Updates
RIP Full Updates
LAN Card
Source Address
Destination Address
Broadcast Address
PVC Connection
SVC Retry Timer
SVC Idle Timer
Max VC
Unnumbered Interface
Inverse ARP
Proxy ARP
IP Interface Secondary Address ConÞguration
Configuring IP Interface Secondary Addresses
Sequence Number
Interfaces,
Adding or Modifying IP Interfaces
Adding or Modifying Secondary Addresses
IPX Interface Configuration
Configuring IPX Node Defaults
IPX Interface Configuration
Configuring IPX Interfaces
Configuring IPX Interfaces 10-3
Frame Type
Interface Type
Network Address
Configuring IPX Interfaces 10-5
NetBIOS Enabled
Diagnostics Enabled
Serialization Enabled
WAN Enabled
Transport Time
Periodic RIP Enabled
RIP Enabled
Watchdog Spoofing
Periodic RIP Timer
NetBIOS Hops
Periodic SAP Timer
SAP Age Timer
RIP Max Size
Adding or Modifying IPX Interfaces
IPX Static SAP Configuration
Configuring IPX Static Routes
Adding or Modifying Static SAP Routes
IPX Static Route Configuration
Router Address
Circuit Index
Network Number
Adding or Modifying IPX Static Routes
Configuring Device-Level Bridging Parameters
Bridge Configuration
Source Route Bridge ID
Virtual LAN ID
Forwarding Table Size
Ethernet Frame Type
Bridge Enabled
IP Enabled
IPX Enabled
Configuring Frame Relay Bridge Ports
Configuring Bridge Ports
Configuring Bridge Ports 11-5
LAN ID
Format
Adding or Modifying Frame Relay Bridge Ports
Configuring LAN Bridge Ports
LAN Card Number
Adding or Modifying LAN Bridge Ports
LAN Type
11-10 Configuring Bridge Ports
SmartSwitch Voice Configuration
Country Code
Configuring System-Level Voice Parameters
Voice Node Number
Country Code
Ring Voltage/Frequency
Dial Digits
Extended Dial Digits
Maximum Voice Rate
Speed Dial Configuration
Changing Parameter Values
Minimum Voice Rate
Long Dial Map
Speed Dial Digits
Extended Dial String
Adding or Modifying Speed Dial Numbers
Dtmf
Configuring Voice Ports
Dial Timer
TE Timer
Call Timer
Level
SLT Timeout
Sample Delay
Jitter
Dtmf On Duration
Forward Delay
Make Ratio
Break Ratio
Auto Poll
Auto Poll Timer
Auto Dial Number
Suppression
Telephony Type
Hunt Group
Tone Type
Ext. Digits Source
Forwarded Type
Forwarded Digits
Fax Supported
Configuring Voice Interfaces
Changing Port Configuration Values
Peer Node Type
Adding or Modifying Voice Interfaces
Viewing Voice Statistics
Clears Received and Transmitted
Call Timeouts
Calls Received and Transmitted
Call Accepts Received and Transmitted
SmartSwitch 1800 Voice Configuration 12-20
Ietf MIB Support
FRX4000, FRX6000, and SmartSwitch 1800 MIB Components
CSI Netlink MIB Support
Index
Index-2
Index-3
Index-4
Index-5
Index-6