Page
Thank You
Table of Contents
Quad Layout
Upper Range
Delete Recording
Start Recording
Delete Image
Delete All Images
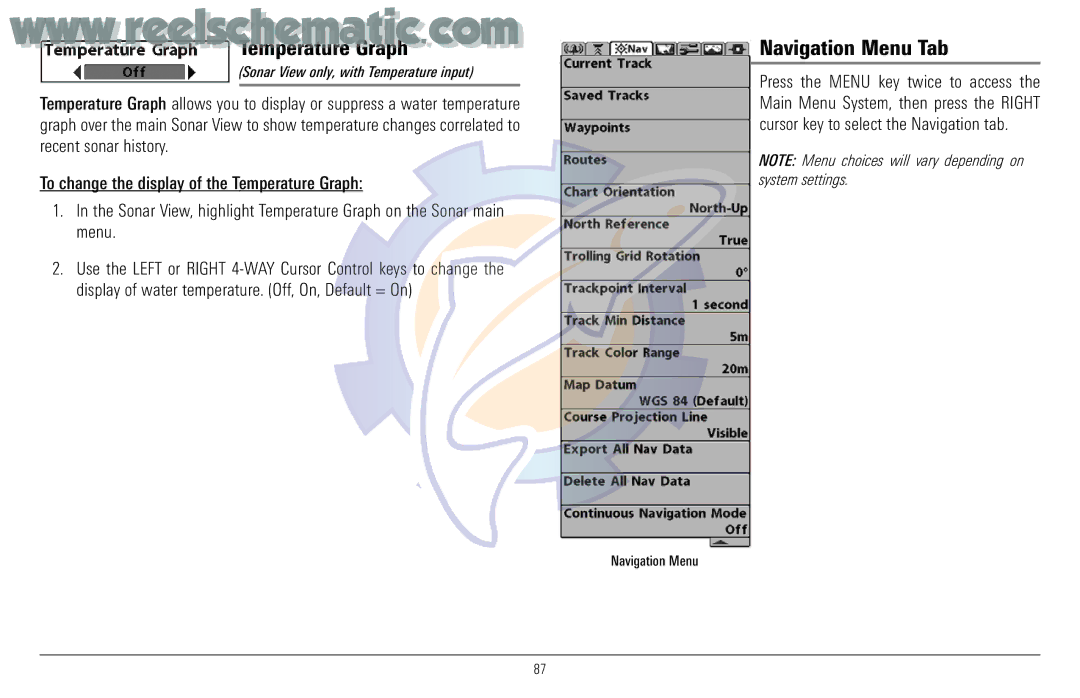
Navigation Menu Tab
Views Menu Tab
Page
How Sonar Works
Series Introduction
DualBeam Plus Sonar
Peak to Peak measures power output at the highest points
Purchase for 917c Combo models only
QuadraBeam Plus Sonar
Universal Sonar
How GPS and Cartography Work
GPS uses a constellation of 24 satellites that
Multi-Media Card MMC/SD Slot
Software Updates Accessory Bus
Installation Overview
Installing the GPS Receiver if included
Control Head Installation
Basic installation tasks that you must perform include
Washer Gimbal Knob Gimbal Bracket
Gimbal Mounting the Control Head
Mounting Screws
Cables Routed Directly Beneath Mounting Bracket
Cables Routed Behind Mounting Bracket
Connecting the Control Head Power Cable to the Boat
Transducer Installation
Locating the transducer mounting location
Transom Transducer Installation
Level
Preparing the Mounting Location
Assembling the Transducer and Initial Mounting
Knuckle
Mounting the Assembly to the Transom
Seam aligned with boat hull
Routing the Cable
Screw
Connecting the Cable
Test and Finish the Installation
Correctly,
Inside the Hull Transducer Installation
Determine the transducer mounting location
Trial installation
Permanently mount the transducer
Route the cable
Are included with the bracket
Trolling Motor Transducer Installation
If you have… Then use
GPS Receiver Installation
Trolling Motor Transducer Options
Abrasion
Stem Mounting with an Existing 1 14 Thread Stem
Follow these steps to stem mount the GPS receiver
No Access Under Mounting Location
Access Under Mounting Location
Finish Routing the Cable Check GPS Receiver Operation
To test the installation
Testing the System Installation
Powering Up the Control Head
Getting Started Using Your 900 Series
Triplog
What’s On the Sonar Display
Bottom Presentation
Understanding Sonar History
Real Time Sonar RTS Window
Key Functions
POWER/LIGHT Key
Menu Key
View Key
Exit Key
View Preset keys
WAY Cursor Control Key
Goto Key has multiple functions, depending on the situation
Info Key
Mark Key
Goto Key
Views and Readouts
Zoom +/- Keys
Views
Sonar View
Sonar View
Sonar Zoom View
Sonar Zoom View
Split Sonar View
Split Sonar View
Snapshot and Recording View
Page
Recording Slider Bar
Recording Playback
Only with QuadraBeam Plus transducer
Side Beam View
555
Bird’s Eye View
Bird’s Eye View
Chart/Bird’s Eye Combo View
Chart/Bird’s Eye Combo View
Chart/Chart Combo View
Chart/Chart Combo View
Chart View with Active Cursor
Chart View
Chart/Sonar Combo View
Chart/Sonar Combo View
Viewing Cartography
Chart Orientation
Navigation
Waypoints, Routes and Tracks
Waypoints, Routes and Tracks
Save, Edit, or Delete a Waypoint
Add a Waypoint Target or Trolling Grid
Navigate to a Waypoint or Position
Save, Edit or Delete a Route
Edit, Delete or Hide Saved Tracks
Save or Clear a Current Track
MOB Navigation
Man Overboard MOB Navigation
Com
Normal Simulator System Status
Start-Up Options Menu
Up Options menu
System Status
Exit Normal operation by powering your 900 Series off
Normal Operation
Simulator
Self Test
Accessory Test
GPS Diagnostic View
Active Side
Sonar X-Press Menu
Sensitivity
Split Position
Advanced Sonar, Split Sonar Active Sonar Side Views only
Upper Range
Lower Range
With QuadraBeam Plus Transducer, Side Beam View only
Chart Speed
Quad Layout
Sonar Colors
Cancel Navigation
Bottom Lock
Bottom Range
Navigation X-Press Menu
Only with an active cursor on a waypoint
Chart or Combo view only
Waypoint Name
Cursor to Waypoint
Skip Next Waypoint
Save Current Track
Clear Current Track
Save Current Route
Remove Grid
Cancel MOB Navigation
To Cancel MOB Navigation
Remove Target
Most recently-created waypoint
Optional-purchase MMC/SD Card, Snapshot Recording View only
Start Recording
Stop Recording
Snapshot and Recording View only
To delete an image
Delete Image
Delete All Images
Delete All Recordings
Delete Recording
To specify playback speed
Pings Per Second
Playback Speed
Sonar Menu Tab
Stop Playback
Transducer will be displayed on the screen
Beam Select
Fish ID+
Fish ID Sensitivity
Zoom Width
Bottom View
Optional-purchase for
To change the 455 kHz Sensitivity setting
KHz Sensitivity
Advanced
Depth Lines
Surface Clutter
Max Depth
Noise Filter
Color Bar
Water Type
Transducer Select
Navigation Menu Tab
Temperature Graph
Sonar View only, with Temperature input
Saved Tracks
Current Track
Waypoints Submenu contains the following menu choices
Waypoints
Routes
North Reference
Track Min Distance
Trolling Grid Rotation
Trackpoint Interval
Export All Nav Data
Track Color Range
Map Datum
Course Projection Line
Delete All Nav Data
Continuous Navigation Mode
Chart Menu Tab
Continuous Navigation Mode allows you to
Map Borders
Chart Detail Level
Shaded Depth
Lat/Lon Grid
Spot Soundings
Navaids on Birds Eye View
Set Map Offset
Set Simulation Position
Clear Map Offset
Alarms Menu Tab
Low Battery Alarm
Depth Alarm
Fish ID Alarm
Temp Alarm
Aux Temp Alarm
Off Course Alarm
Arrival Alarm
Alarm Tone
Drift Alarm
International only
Setup Menu Tab
Units Depth
Units Temp
Language
User Mode
Units Distance
Units Speed
Select Readouts
Triplog Reset
Restore Defaults
Off Triplog Position Voltage Aux. Temperature
Page
Temp Offset
Depth Offset
Aux Temp Offset
Position Format
Speed Calibration
Local Time Zone
Daylight Saving Time
Advanced, International only
Time Format
Date Format
Nmea Output
Digits Format
Views Menu Tab
Following views are available
Using Screen Snapshot
Accessories Menu Tab
To turn Screen Snapshot on or off
Series Doesn’t Power Up
Troubleshooting
Control head loses power at high speeds
Display Problems
Finding the Cause of Noise
Humminbird Service Policy
Year Limited Warranty
Returning Your Unit for Service
Series include
Series Accessories
Page
Specifications
Glossary
123
Com Atic
Receiver See Transmitter
Com Atic
Sonar Terms
Glossary GPS & Navigation Terms
129
Glossary GPS & Navigation Terms
Glossary GPS & Navigation Terms
Glossary GPS & Navigation Terms
Contact Humminbird