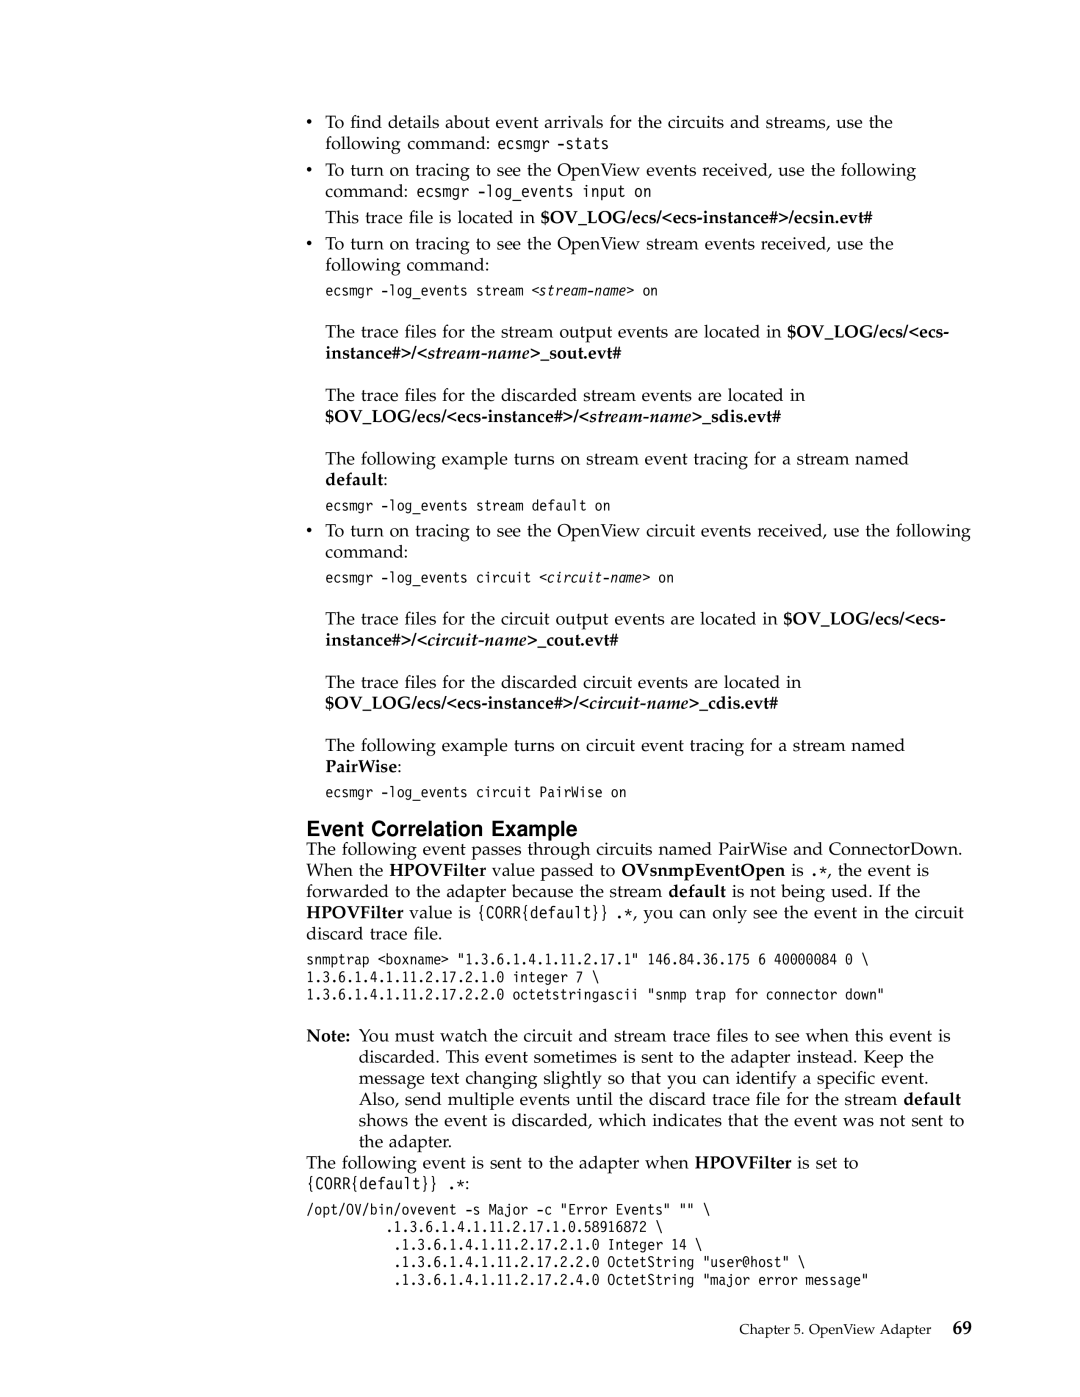
Enterprise Console specifications
IBM Enterprise Console is a robust solution designed to centralize and streamline IT operational monitoring and management. As organizations increasingly rely on complex IT infrastructures, including cloud services, on-premise systems, and hybrid environments, the need for an effective monitoring tool has become paramount. IBM Enterprise Console addresses these needs by providing a comprehensive view of IT operations, enabling organizations to respond to incidents with agility and precision.One of the key features of IBM Enterprise Console is real-time monitoring. The solution offers a single pane of glass through which IT teams can observe the performance of various systems and applications. This capability allows organizations to detect and respond to incidents promptly, minimizing downtime and ensuring that services remain available for end users. The console integrates seamlessly with multiple data sources, allowing for the aggregation of alerts, events, and logs from diverse IT environments.
Another significant aspect of IBM Enterprise Console is its automation capabilities. The platform supports automated workflows and incident management processes, helping to reduce the workload on IT teams. Automation not only enhances efficiency but also ensures consistency in incident response. By leveraging predefined rules and actions, organizations can standardize their operational protocols, leading to faster resolution times and improved service quality.
The IBM Enterprise Console utilizes advanced analytics and artificial intelligence to enhance operational insights. Machine learning algorithms can help identify patterns and anomalies in system performance, allowing organizations to anticipate potential issues before they escalate into critical incidents. This proactive approach to IT monitoring not only improves reliability but also fosters a culture of continuous improvement across the organization.
Security features are also integrated into the IBM Enterprise Console, allowing for the monitoring of security incidents alongside IT operations. This unified approach helps organizations to respond more effectively to security threats, enabling them to correlate operational and security data for a comprehensive view of their infrastructure.
In conclusion, IBM Enterprise Console stands out as a powerful tool for IT operations management. Its real-time monitoring, automation capabilities, advanced analytics, and integrated security features make it an ideal solution for organizations looking to enhance operational efficiency and responsiveness. By leveraging this technology, businesses can ensure that their IT environments remain stable, secure, and aligned with their strategic goals.
