CHARTS, GRAPHS AND TRENDS
Heavy Weather Pro provides the ability to analyze the weather data collected from the weather station and its sensors using graphical charts of the data.
The software collects data from the weather station and stores it in a history data file (~\My Documents\HeavyWeather\History\history.dat by default). The stored data file is then used to generate different kinds of graphical reports for analysis.
OVERVIEW
The three main building blocks of graphical analysis in Heavy Weather Pro are the history file that stores the data records, the templates that define the properties of the charts/graphs and the graphs themselves.
THE HISTORY FILE
The history file is a data storage file generated by the Heavy Weather Pro application. It contains sets of weather data collected by the weather station during a period of time. We use this data to plot graphs over a specific period of time for analysis.
History files can be renamed, to preserve specific data such as the data collected during a big storm.
To write history data to a different filename, you must enter the new filename in the PC Software Settings section of Heavy Weather Pro.
You can have as many different history files as you wish, but to use them for graphing purposes, they must be in the correct history folder ‐ (~\My Documents\HeavyWeather\History\ by default).
WHAT IS A TEMPLATE?
To plot a graph you need to specify certain properties such as type of data (temperature, humidity, etc), duration of time, color and axis of the graph, minimum and maximum of the axis value, etc.
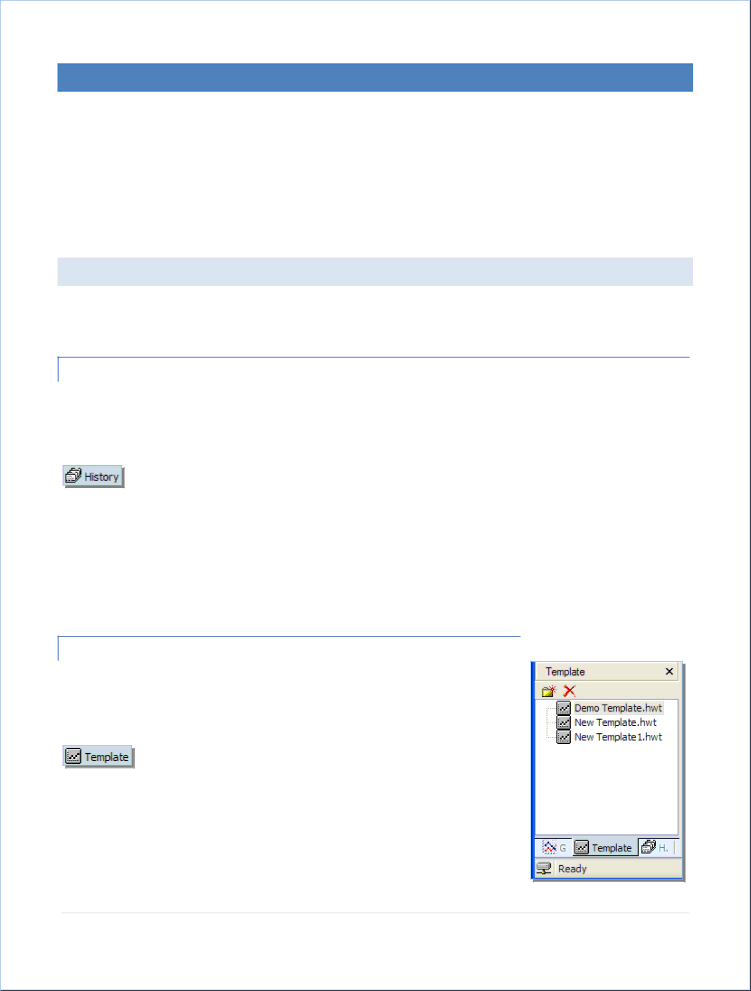
A template defines these properties and allows you use them again and again without setting them up each time. You can create and
save an unlimited number of templates to suit your own applications. There is only one prerequisite to creating a template ‐ you must have at least one history file in the history directory.
