Minutes:
The ‘minutes’ field can only be modified if you choose a Data Interval of User Defined. In this case, you can specify how many minutes apart you wish to place the data points. The chart can only be as precise as the original recording interval.
When you are using a pre‐defined interval (any interval other than User Defined), the minutes field will be read only and display the chosen interval in minutes.
STATUS
The status section of the Properties window tells us if the data type and intervals we have chosen are valid. If we have selected to display a data type or a time period that is not available in our data records, the status line will turn red to indicate that the data cannot be displayed. If our selections are valid, the status text will be green.
SAVING A TEMPLATE AS A GRAPH
To display weather data in a chart of graph format, we first need to select the history data and create a template. If you have not yet done this, please refer to the sections on Working with History Files and Working with Templates. You can also choose to use the demo template to get some practice working with graphs.
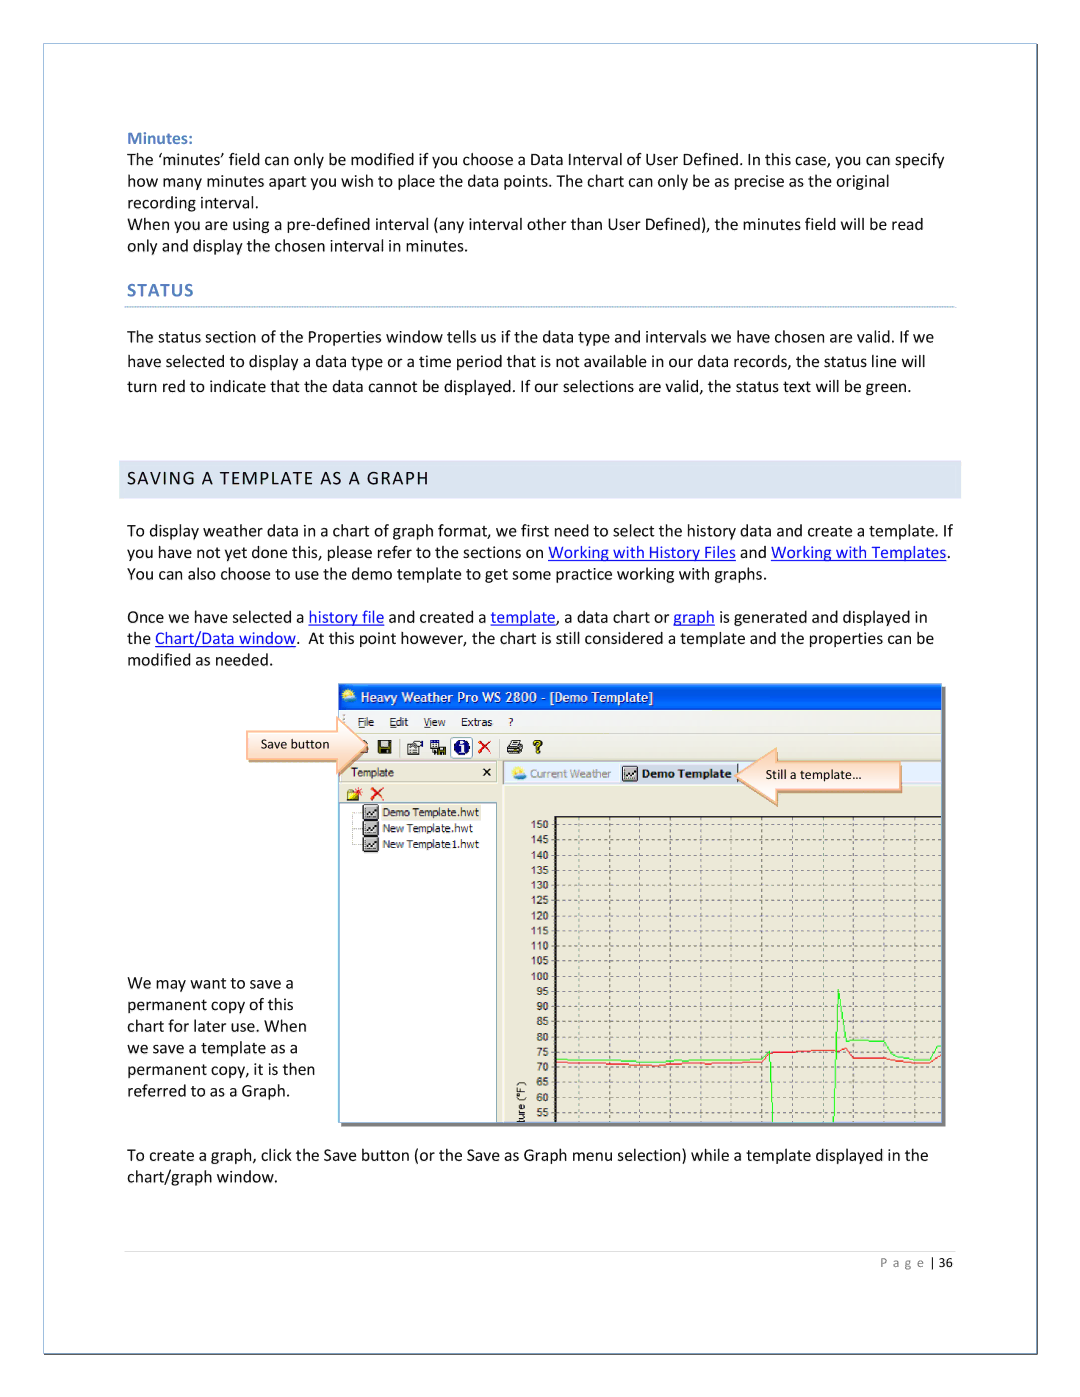
Once we have selected a history file and created a template, a data chart or graph is generated and displayed in the Chart/Data window. At this point however, the chart is still considered a template and the properties can be modified as needed.
Save button
We may want to save a permanent copy of this chart for later use. When we save a template as a permanent copy, it is then referred to as a Graph.
Still a template…
To create a graph, click the Save button (or the Save as Graph menu selection) while a template displayed in the chart/graph window.