Navini Networks, Inc. | Ripwave MX Modem User Guide |
The Configuration Screen, At the bottom of the screen is an Allow Customer Satisfaction
continuedReporting box. This box gives you control over whether your Service Provider is allowed to monitor your Modem’s performance using the remote CPE Logging function and store the log files created by the CPE Logging function on your computer. By default, this box is checked which means the Service Provider can monitor your Modem.
The Trend Analysis Screen
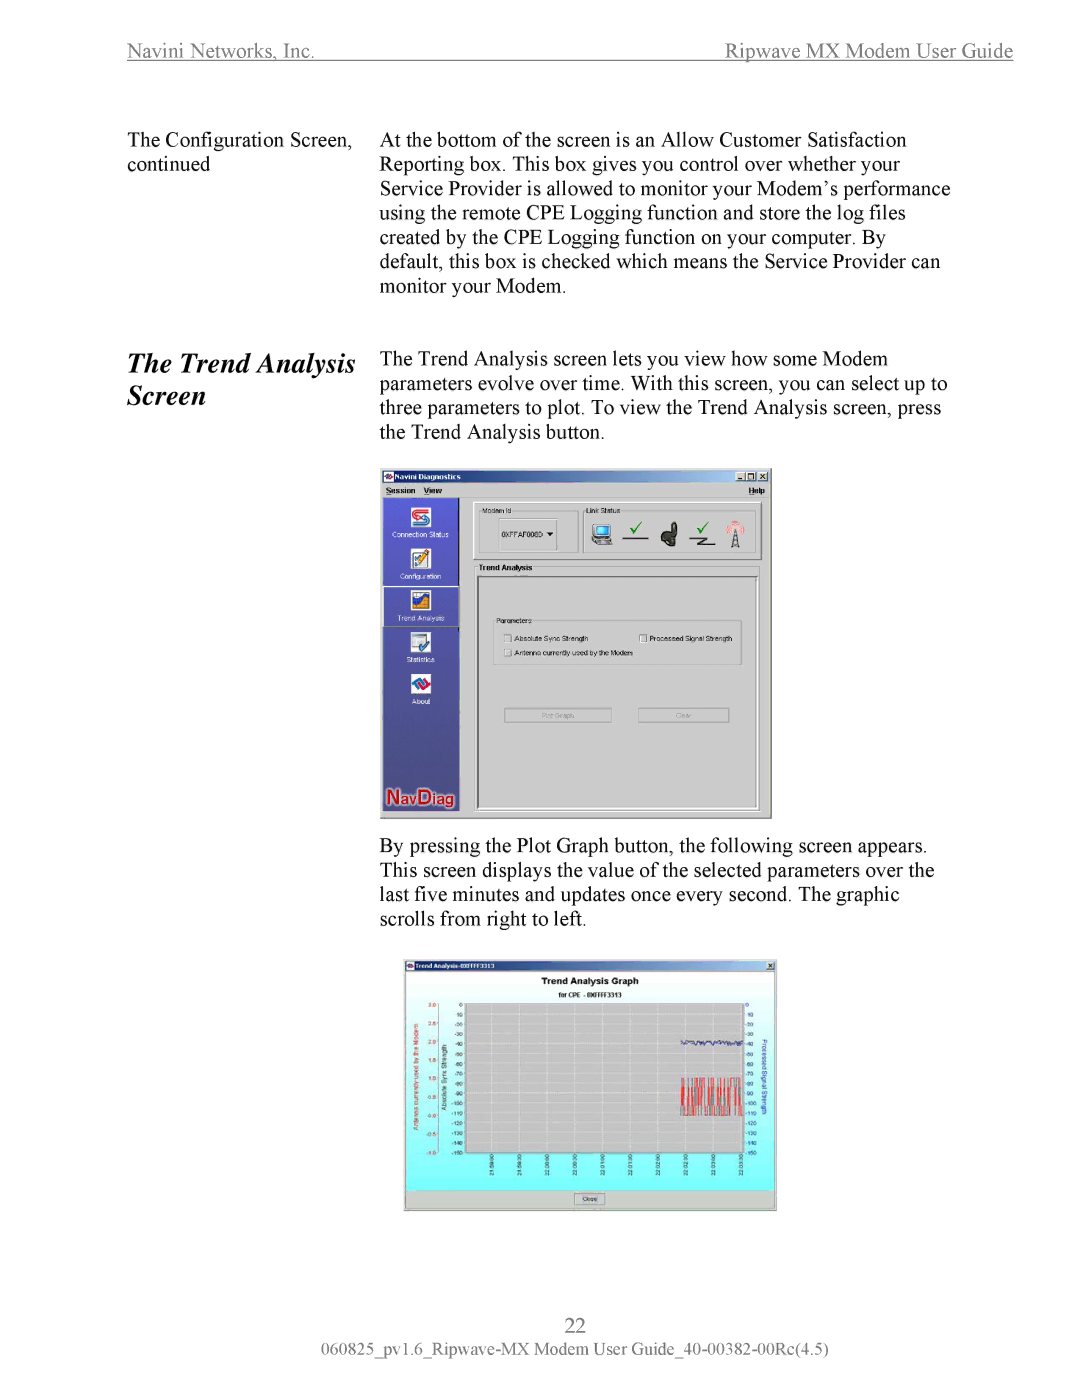
The Trend Analysis screen lets you view how some Modem parameters evolve over time. With this screen, you can select up to three parameters to plot. To view the Trend Analysis screen, press the Trend Analysis button.
By pressing the Plot Graph button, the following screen appears. This screen displays the value of the selected parameters over the last five minutes and updates once every second. The graphic scrolls from right to left.
22