3.Registro barométrico 0 (actual) a – 24 horas

4.Indica que la alarma de presión está activada

5.El usuario puede seleccionar la unidad de medición de altura / presión

PRECIPITACIÓN


1


5


2


6


7


3


8


4


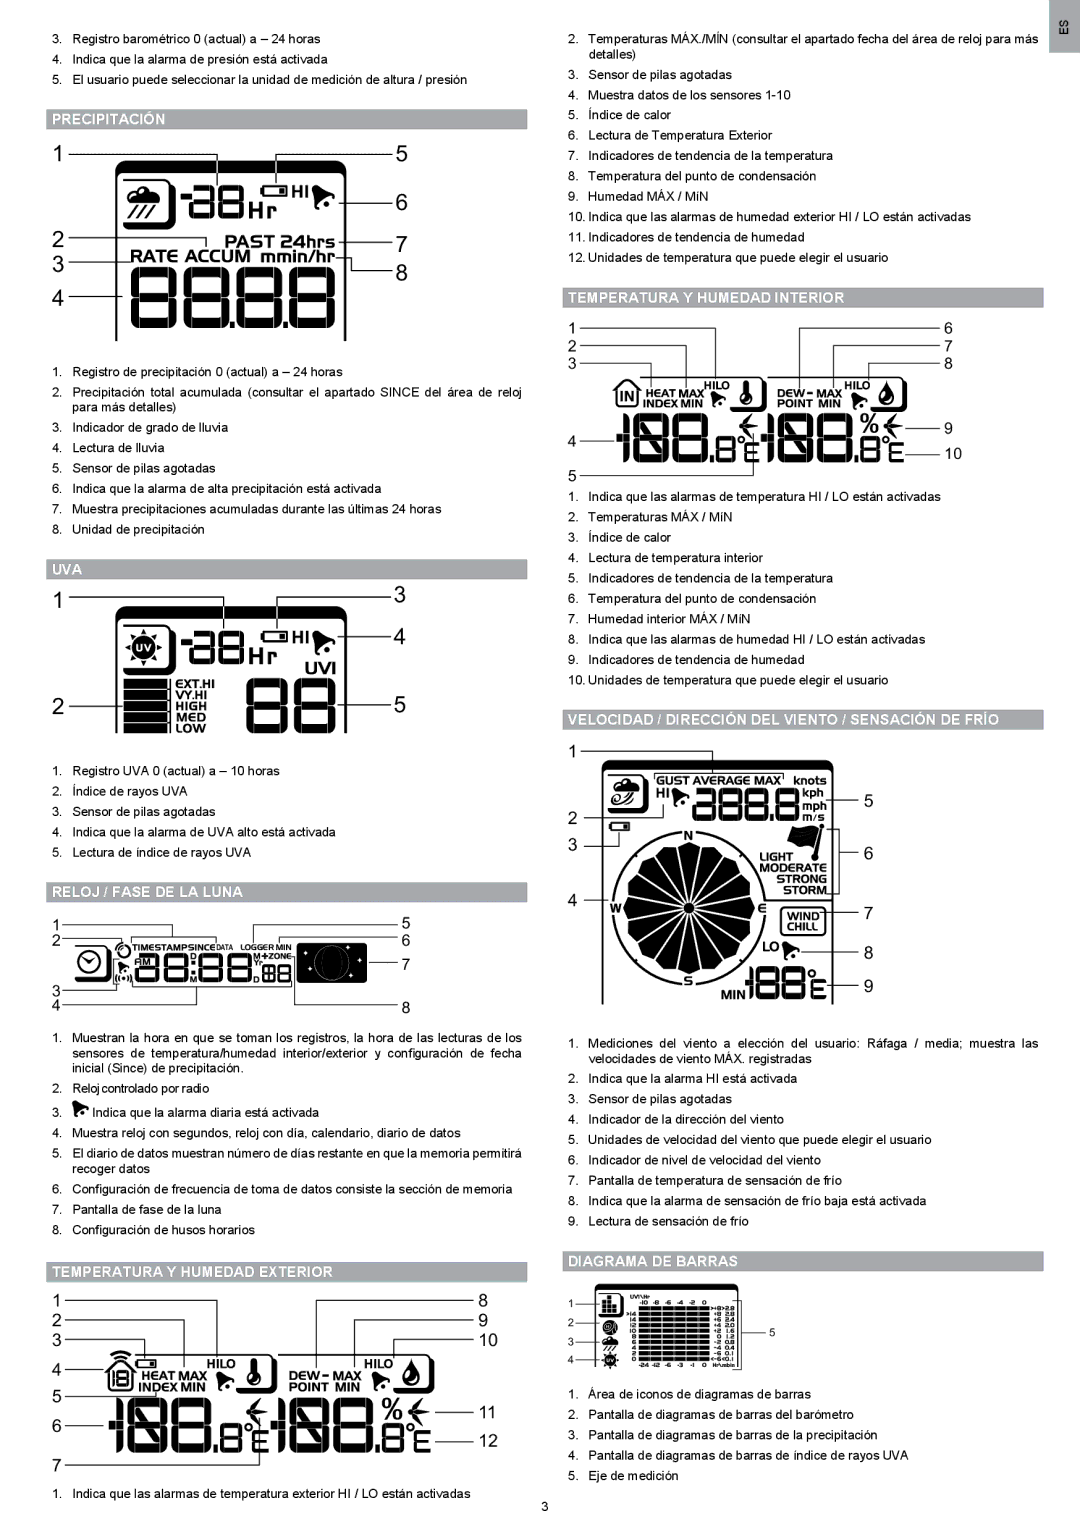
1.Registro de precipitación 0 (actual) a – 24 horas

2.Precipitación total acumulada (consultar el apartado SINCE del área de reloj para más detalles)

3.Indicador de grado de lluvia

4.Lectura de lluvia

5.Sensor de pilas agotadas

6.Indica que la alarma de alta precipitación está activada

7.Muestra precipitaciones acumuladas durante las últimas 24 horas

8.Unidad de precipitación

UVA


1

3

4

2 5

1.Registro UVA 0 (actual) a – 10 horas

2.Índice de rayos UVA

3.Sensor de pilas agotadas

4.Indica que la alarma de UVA alto está activada

5.Lectura de índice de rayos UVA

RELOJ / FASE DE LA LUNA

1


5

2


6


DATA

LOGGERMIN


3


7


4


8


1.Muestran la hora en que se toman los registros, la hora de las lecturas de los sensores de temperatura/humedad interior/exterior y configuración de fecha inicial (Since) de precipitación.

2.Relojcontrolado por radio

3. Indica que la alarma diaria está activada

4.Muestra reloj con segundos, reloj con día, calendario, diario de datos

5.El diario de datos muestran número de días restante en que la memoria permitirá recoger datos

6.Configuración de frecuencia de toma de datos consiste la sección de memoria

7.Pantalla de fase de la luna

8.Configuración de husos horarios

TEMPERATURA Y HUMEDAD EXTERIOR

2.

Temperaturas MÁX./MÍN (consultar el apartado fecha del área de reloj para más

ES


detalles)


3.

Sensor de pilas agotadas


4.

Muestra datos de los sensores 1-10


5.

Índice de calor


6.

Lectura de Temperatura Exterior


7.

Indicadores de tendencia de la temperatura


8.

Temperatura del punto de condensación


9.

Humedad MÁX / MíN


10. Indica que las alarmas de humedad exterior HI / LO están activadas


11. Indicadores de tendencia de humedad


12. Unidades de temperatura que puede elegir el usuario


TEMPERATURA Y HUMEDAD INTERIOR


1


6


2


7


3


8


9


4


10


5


1.Indica que las alarmas de temperatura HI / LO están activadas

2.Temperaturas MÁX / MíN

3.Índice de calor

4.Lectura de temperatura interior

5.Indicadores de tendencia de la temperatura

6.Temperatura del punto de condensación

7.Humedad interior MÁX / MíN

8.Indica que las alarmas de humedad HI / LO están activadas

9.Indicadores de tendencia de humedad

10.Unidades de temperatura que puede elegir el usuario

VELOCIDAD / DIRECCIÓN DEL VIENTO / SENSACIÓN DE FRÍO

1

2


5


3


6


4


7


8

9

1.Mediciones del viento a elección del usuario: Ráfaga / media; muestra las velocidades de viento MÁX. registradas

2.Indica que la alarma HI está activada

3.Sensor de pilas agotadas

4.Indicador de la dirección del viento

5.Unidades de velocidad del viento que puede elegir el usuario

6.Indicador de nivel de velocidad del viento

7.Pantalla de temperatura de sensación de frío

8.Indica que la alarma de sensación de frío baja está activada

9.Lectura de sensación de frío

DIAGRAMA DE BARRAS


1


8


2


9


3


10

4


1

2

3

4

5

5

11

6

12

7

1. Indica que las alarmas de temperatura exterior HI / LO están activadas

1.Área de iconos de diagramas de barras

2.Pantalla de diagramas de barras del barómetro

3.Pantalla de diagramas de barras de la precipitación

4.Pantalla de diagramas de barras de índice de rayos UVA

5.Eje de medición

3

Page 15
Image 15
Oregon Scientific WMR200 Precipitación, Uva, Reloj / Fase DE LA Luna, Temperatura Y Humedad Interior, Diagrama DE Barras

WMR200 specifications

The Oregon Scientific WMR200 is a versatile and advanced weather station designed for enthusiasts and professionals alike. Renowned for its user-friendly interface and robust functionality, the WMR200 is an excellent tool for monitoring both indoor and outdoor weather conditions.

One of the main features of the WMR200 is its array of sensors that provide comprehensive weather data. It includes an anemometer for measuring wind speed and direction, a rain gauge for precipitation measurement, and a thermo-hygrometer for tracking temperature and humidity levels. This combination allows users to analyze various weather elements, enhancing their understanding of local climate patterns.

The wireless technology embedded in the WMR200 is another key characteristic. The system utilizes advanced wireless transmission that allows sensors to communicate wirelessly with the main console, reducing the need for cumbersome cables. This feature not only simplifies setup but also enhances the overall aesthetic of the installation. The range of the wireless transmission is impressive, typically covering distances of up to 100 meters, depending on environmental factors.

The main console of the WMR200 features a clear LCD display that provides real-time readings of the collected data. Users can easily switch between various weather parameters, ensuring they have the most pertinent information at their fingertips. Additionally, the console can store historical weather data, enabling users to track changes over time and identify trends.

Another significant advantage of the WMR200 is its compatibility with online weather services. Users can sync their weather station with various online platforms, allowing them to share their data with a broader community or access specific analytical tools. This connectivity extends the utility of the WMR200 beyond individual use, fostering collaboration among amateur meteorologists and enthusiasts.

Furthermore, the WMR200 is designed with durability in mind. The sensors are built to withstand various weather conditions, ensuring accurate readings regardless of the elements. The materials used in the construction of the unit are weather-resistant, making it suitable for outdoor installation.

In summary, the Oregon Scientific WMR200 combines advanced technology with user-friendly design, catering to a diverse audience interested in weather observation. Its comprehensive sensor array, wireless features, historical data storage, and online connectivity make it an essential tool for anyone keen on understanding and monitoring weather dynamics. Whether for personal curiosity or professional applications, the WMR200 stands out as a reliable and effective weather station.