GXR Digital Camera Body Camera Body User Guide
Package Contents
Their respective owners
Safety Precautions
Sample Warnings
Warning
Page
Vii
Keep the equipment out of the reach of children
Caution
Viii
Product Manuals
Table of Contents
101
120
126
151
Xii
Before You Begin
Microphone Strap eyelet Alignment mark for attaching
Parts of the Camera Body
Front
Back
Mode Dial
4scene
When viewing pictures or
Up-down Dial and ADJ. Lever
Navigating the menus, you can Use the up-down dial in place
Direct Button
Changing the Shooting Settings on the Direct screen
Direct screen
Displaying the Options for the Shooting Settings
Displaying the Next or Previous
Picture Display
Battery level
Shutter speed 46, 49
Exposure
Movie length...63
Battery Level Indicator
Icon
Basic Photography and Playback
Charging the Battery
Place the battery in the charger
Connect the power cord to the charger, and then plug
Prepare the camera for use
Battery may be hot immediately after use. Before removing
Remove the battery
Tip Battery Capacity
Inserting the Battery
Open the battery/card cover. Unlatch 1 and open
Close the battery/card cover. Close 1 and latch 2 the cover
Removing the Battery
Open the battery/card cover
Inserting Memory Cards
Unlatch 1 and open Cover
Insert the card
Keep the memory card contacts clean
Slide the write-protection switch on
Removing Memory Cards
Tip Write Protection
Attaching the Camera Unit to the Camera Body
Removing the Camera Unit from the Camera Body
Turning the Power On and Off
Shooting Mode
Playback Mode
Tip Sleep Mode and Auto Power Off
Basic Setup
Taking Photographs
Holding the Camera
Taking a Photograph
Focus frame blinks red Autofocus/flash lamp blinks
Green
Take a picture
Focus status Focus frame
Tip Shutter-Release Button
Tip Focus
Tip Avoiding Blurred Pictures
Focus Lock
Recompose the photograph
Press the shutter-release button halfway
Frame the picture using the 8and 9buttons Focus
Zoom
Close-ups Macro Mode
Use macro mode for close-ups of small objects
Press the Nbutton. a Nicon will be briefly
Focus
Mode Description
Flash Photography
Auto
Flash
Focus and shoot
Using the Built-in Flash
Raise the flash
First-time Ruser? ead this
Self- Timer
Choose a self-timer mode
Start the timer
Press C/Dto cancel the custom setting timer during shooting
Tilt Indicator
Display options
Select an option
Press + or to highlight an option, and press
Understanding the Tilt Indicator
Beep does not sound if the camera’s volume is set off
Viewing Photographs
Pictures can be viewed in the picture display
+ to go back ten frames
Tip If the Camera Is Off
Tip Viewing Pictures in Shooting Mode
Fn2
Tip Auto Rotate
Viewing Multiple Photographs
Tip Viewing the Pictures in Internal Memory
Tip Directional Pad
Playback Zoom
Following operations can be performed
Maximum magnification varies with image size
Use
Deleting All Files
Deleting Photographs
Deleting Individual Photographs
Deleting Multiple Files
Select a photograph
Follow the steps below to delete multiple files
DISP. files
Confirmation dialog will be displayed
Select Yes
Press Fn1 or Fn2 to highlight Yes, and press C/D
Tip Selecting Ranges
ODISP. Button
Turning the Picture Display On/Off
Tip The Framing Grid
See page 144 on choosing a type of framing grid
Tip Highlights
Highlights
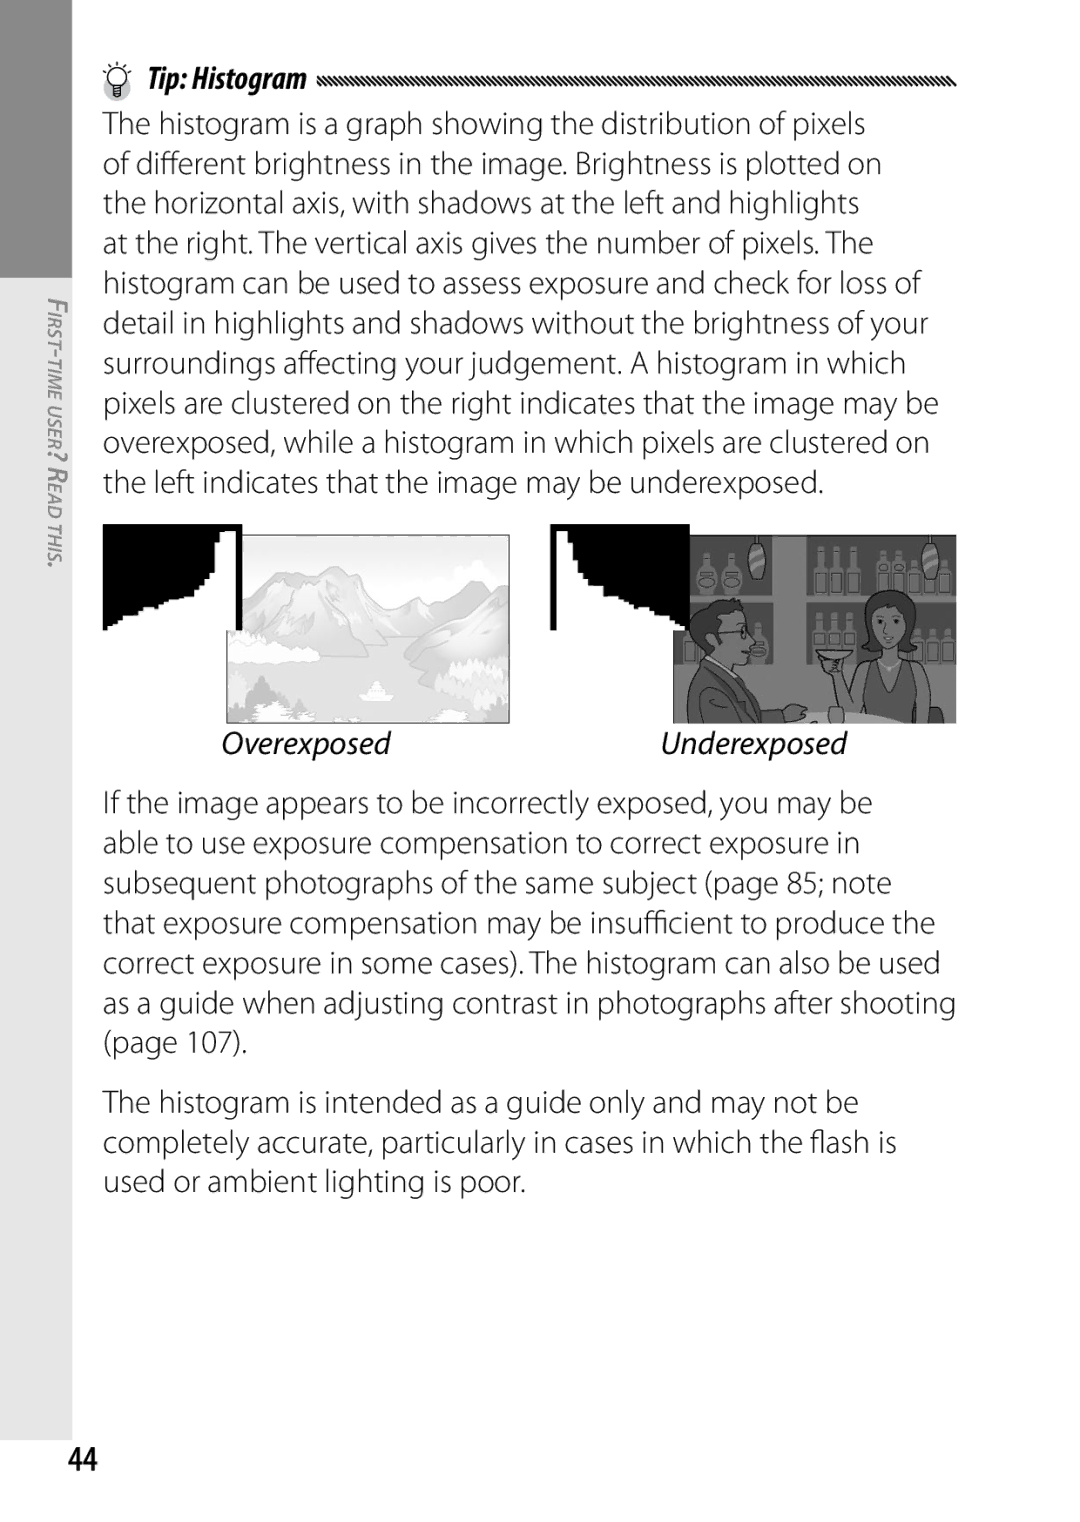
Tip Histogram
OverexposedUnderexposed
Reference
Read this section for more information on camera functions
Mode P Program Shift
Choose mode P
Choose shutter speed and aperture
Release the shutter-release
Take a picture
Choose an aperture
Mode a Aperture Priority
Choose mode a
Choose shutter speed
Mode S Shutter Priority
Choose mode S
Take a picture
Mode M Manual Exposure
Choose mode M
Choose slower shutter speeds for longer exposure times
4Mode Settings for Various Scenes
Option Description Movie
Portrait
Sports
Press C/D
Rotate the mode dial to
Skew correct mode See
Recording Movies
Shoot movies with sound. Movies are stored as AVI files
Select 3in 4mode
Press + or to highlight 3movie, and press C/D
Sounds made by the camera may be recorded with the movie
4Mode Skew Correct
Tip Skew Correction
MY Modes Using Custom Settings
Rotate the mode dial to MY1, MY2, or MY3
Shooting mode saved
Using Reg. My Settings will
Shooting Menu
Tip 4Mode
A, S, M, MY1, MY2 and MY3 Modes
4Mode Landscape
4Mode Movie
4Mode Portrait/Sports/Nightscape
Flash Exposure Compensation Option
4Mode Skew Correct
Picture Quality/Size / Movie Size
For Still Images
For Movies
Tip Picture Quality
VGA640 640×480
320×240
When MF, Snap, or ∞ is selected
Tip Depth of Field
Focus MF Manual Focus
Choose the focus distance
Using the option selected for Focus
Choosing the Focus and Metering Target
Exposure target
Target selection is off
Target selection is not available in manual focus mode
Snap Focus Distance
Macro Target Selection
Full Press Snap
Tip Autofocus
Function is off
Shutter response is required
When Center or Spot is selected
Pre-AF
Exposure Metering
Choose how the camera measures light for exposure
Image Settings
At settings other than Standard
Return to the Image Settings menu
Press C/Dwhen settings are complete
Exit to shooting mode
Press C/D, or press Fn1 and then press C/D
Continuous Mode
Plus can be selected from M-Cont + HI and M-Cont + LO
MP is a file format for recording a set of still images
At settings other than Off,
Tip MP file
Auto Bracket
Current selection is shown by
Return to shooting mode
AE-BKT Exposure Bracketing
To specify variations for exposure value
Select AE-BKT
TE copy
CL-BKT Color Bracketing
Tip Contrast, Sharpness, and Color Depth
Exposure compensation value and press C/D
See page 28 for information on using the flash
Flash Exposure Compensation
Flash Synchro Settings
Manual Flash Amount
Choose how the flash synchronizes with the shutter
Full 1/1.4 1/2 1/2.8 1/4 1/5.6
Noise Reduction
Noise Reduction ISO
Auto Macro
Is displayed when distortion correction is on
Distortion Correction
Custom Self-Timer
Start shooting
Interval Shooting
Choose an interval
End shooting
Press C/Dto end shooting
Date Imprint
Date cannot be imprinted on movies
Exposure Compensation
Exposure compensation is not available in mode M
White Balance
At settings other than Auto,
Display white balance options
Press C/Dto return to shooting mode
Manual Measuring White Balance
To measure a value for white balance
Select Detail
Selecting White Balance
Choose a setting
White Balance Compensation
ISO Setting
White balance compensation is shown in the picture display
Shoot or return to the shooting mode
Restore Defaults
Press + or to select an option
Press the shutter-release button to take a picture, or
Switch Shooting Mode
Eis displayed when camera shake correction is on
Auto Aperture Shift
Camera Shake Correction
More on Photography
Viewing Movies
Press the 6button
Display the movie
Start playback
Viewing MP Files
Display for step
Thumbnail view
Single frame view
Operations during slide show are shown below
Individual frame of an MP file cannot be deleted
Slide Show
Last Frame
Exporting MP Files
Press the 6button Display the MP file you want to export
View, and then go to step
Playback menu appears
Selecting One Frame
Specifying Multiple Frames Separately
Press + or to select Sel Mult, and then press C/D
Press the Nbutton Select Yes, and then press C/D
Specifying a Range of Multiple Frames
100
Selecting All Frames
Select Yes, and then press
Playback Menu
Display the playback menu. Press C/D Select a menu item
Playback menu contains the following options
101
Setting/Canceling Multiple files at a Time
Flag Function Setting
Setting/Canceling One File at a Time
103
Select additional photographs
Flag Function Display
Resize
104
Display the photograph to be copied in playback mode
Trim
Select Trim
Trim the photograph
Level Compensation
Auto Automatic Level Compensation
Select Auto
106
107
Copy the image
Manual Manual Level Compensation
Or right to adjust brightness
108
Tip Choosing the Black Point, White Point, and Mid-Point
Correcting exposure If the image is
109
Create copies with modified white balance
Select White Balance Compensation
Skew Correction
110
Slide Show
111
Protect
Protecting Individual Pictures
Other pictures. Highlight 1 File and press C/D
112
113
Changing the Protect Status of Multiple Files
Select Protect in the playback menu, and press Fn2
Press the Nbutton
114
Tip Dpof
Copy to Card from Internal Memory
115
Selecting Multiple Photographs for Printing
To select multiple photographs for printing
Select Dpof
116
117
Recover File
Until zero is displayed
Viewing Pictures on TV
119
120
Connecting the Camera Body
Connect the USB cable to the printer
Plug the cable into the USB cable connector
121
Printing
Printing Photographs One at a Time
To print a selected photograph
At right will be displayed Highlight 1 File and press C/D
123
124
Select Cancel to exit without changing the default setting
Start printing
Adjust printer settings
Printing Multiple Photographs
Press the Zbutton
125
126
Display the menus
Select a tab
Key custom options tab contains the following options
127
Setup tab contains the following options
128
Reg. My Settings
Adjust settings
Key Custom Options
129
130
Recall My Settings
131
Edit My Settings
Select a setting
Edit settings
Save changes and exit
My Settings for Fn Settings
My Settings WB Comp
Tip Naming My Settings
133
ADJ Lever Setting
134
Using the ADJ. Lever
To select an option currently assigned to the ADJ. lever
ADJ Shutter Confirmation
135
Set Fn1/Fn2 Button
136
Sizes in RAW Data
+/- Button Settings
137
Playback Mode Dial Options/M Mode Dial Options
One Press M Mode
When exposure compensation is assigned to the +
138
Setup
Format Card/Format Internal Memory
LCD Brightness
139
ISO Auto-High Settings
Direct Screen Transparency
Exposure/Flash Comp. Step
AF Auxiliary Light
Sleep Mode
Auto Power Off
Playback Screen
141
Volume Settings
LCD Auto Dim
LCD Confirmation Time
Operation Sounds
143
One Press Zoom Ratio
Auto Rotate
Level Setting
Choose the type of framing grid available in shooting mode
Minimum Shooting Distance
Grid Guide Display Options
Show My Setting Name
Fn Button Display
Select On to display shooting
145
146
Color Space Setting
CL-BKT Black & White TE
147
Digital Zoom Image
Store Menu Cursor Position
Card Sequence No
148
Date Settings
Video Out Mode
Language/L
Hdmi Output
Start Settings Readout
150
Windows
151
Windows 2000/Windows XP 256 MB or more
System Requirements
152
Installing the software Install the following software
Supplied CD
153
DL-10 Copy pictures to the computer in a single operation
Caplio software DC software
Installing the Software
154
155
Installing Adobe Reader
Click Finish
Restart the computer
Computer. Select Yes, I want to restart my computer
157
Contents of the CD will be displayed
Install Adobe Reader
Uninstalling the Software
158
Cable connected
Copying Pictures Using DL-10
159
Restart the computer and repeat the above steps
Copying Pictures Without Using DL-10
160 Turn the camera body off Connect the supplied USB cable
Disconnecting the Camera Body
161
Macintosh
Camera body can be used with Mac OS X versions
Copying Pictures to a Macintosh
162
Desktop with pictures stored in folders as shown
Appear as a volume on
163
Using the MP File Viewer
System Requirements for Using the Supplied MP file viewer
Following environments are necessary for using
164
Installing VM-1
Uninstalling VM-1
Double-click the VM-1 Uninstaller icon
Uninstall confirmation dialog will be displayed. Click OK
Open the VM-1 utility folder
Troubleshooting
Error Messages
Message Solution
167
Camera Body-Related Problems
Power Supply
Problem Cause
168
169
Problem Cause Solution
Shooting
170
Playback/Deletion
171
Cause Solution
Computer-Related Problems
Security Alerts Windows Vista/Windows XP
173
Connect A/V cable
Open the Windows Firewall Control Panel. Open the Start menu
Corner of the Control Panel window
Specifications
175
176
Internal Memory/Memory Card Capacity
177
Optional Accessories
178
179
SC-55S soft case
Camera System and Accessories
180
GF-1 Flash Unit Optional
Close the flash cover Attach the flash
+, -,Fn1, Fn2 or the ADJ
Mode
Choose a manual ISO sensitivity setting
Other Flash Units
Set aperture manually
Turn the flash on
Using the Product Abroad
Precautions for Use
Using BJ-9 Battery Charger
Warranty
184
Do not apply force to the picture display
Before Cleaning
Care and Storage
Caring for this product
Storage
Warranty and Servicing
186
187
USA FCC Part 15 Class B
Index
189
119
190
Telephone Support Numbers in Europe
If You Encounter a Problem with This Product
To reduce the environmental loads of digital cameras