Spectrum Analyze Mode
Spectrum Analyze Mode
Analyze menu
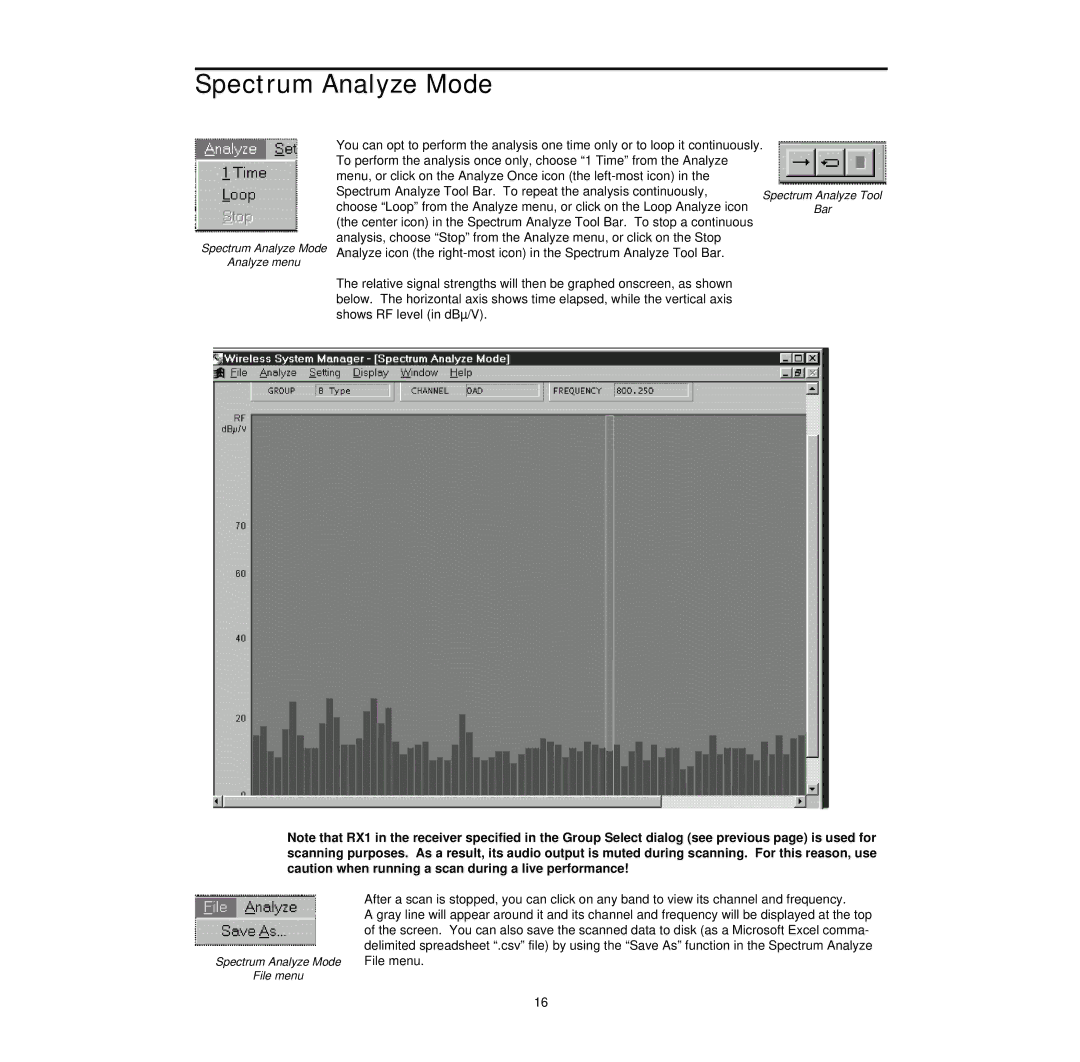
You can opt to perform the analysis one time only or to loop it continuously. To perform the analysis once only, choose “1 Time” from the Analyze menu, or click on the Analyze Once icon (the
The relative signal strengths will then be graphed onscreen, as shown below. The horizontal axis shows time elapsed, while the vertical axis shows RF level (in dBµ/V).
Note that RX1 in the receiver specified in the Group Select dialog (see previous page) is used for scanning purposes. As a result, its audio output is muted during scanning. For this reason, use caution when running a scan during a live performance!
Spectrum Analyze Mode
File menu
After a scan is stopped, you can click on any band to view its channel and frequency.
A gray line will appear around it and its channel and frequency will be displayed at the top of the screen. You can also save the scanned data to disk (as a Microsoft Excel comma- delimited spreadsheet “.csv” file) by using the “Save As” function in the Spectrum Analyze File menu.
16