EL-9900
For Your Records
Their respective holders
Introduction
Reversible Keyboard
Basic Mode
Advanced Mode Default mode
Contents
Chapter Matrix Features 120
Chapter Slide Show Feature 115
Chapter
Chapter Statistics & Regression Calculations 145
Chapter List Features 131
Chapter Financial Features 183
Chapter Solver Feature 194
Chapter Option Menu 222
Chapter Programming Features 202
Appendix 228
265
Index
Caring for Your Calculator
Before Use
Getting Started
Display contrast
Using the Hard Cover
Adjusting
Calculator OFF Automatic power off function
Main Unit
Part Names and Functions
Display screen
Power ON/OFF key
Basic Operation keys
Reversible Keyboard
Getting Started
Example
Basic Key Operations
To change Keyboard
Changing the Keyboard
Basic → Advanced
Quick Run-through Basic Mode
Advanced → Basic
Set up the calculator before calculation Enter fractions
Change answer 1. Press @ Mode from Fractions to Decimals
Basic Key Operations Standard Calculation Keys
How to switch the keyboard
Operating the Graphing Calculator
Basic / Advanced Keyboard
Negative value
Entering numbers
Number entry Example
Entering a
Performing standard math calculations
Cursor Basics
Method
About the Insert
Editing Entries
Cursor naviga
Tion
Second Function Key
Alpha Key
Math Function keys for Basic keyboard
Math Function Keys
Math Function keys for Advanced keyboard
Common Math Function Keys for both keyboards
Examples
MATH, STAT, and Prgm Menu Keys
Calculator’s then . configuration
Setup Menu
Setup Menu Items
Operating the Graphing Calculator
Precedence of Calculations
10 +
Error Messages
Using the reset switch
Resetting the Calculator
Selecting the Reset within the Option menu
Try it
Basic Calculations Basic Keyboard
Concept
Procedure
Subtraction
Arithmetic Keys
Performing
Addition
Entering a number with a negative value
When to leave out the ⋅ sign
Specifying no common factor
Calculations Using Various Function Keys
Specifying a common factor
Example
RAA E RAB E AA +AB E
Functions
Second
RAC E
Example
Calc
Calculations Using Math Menu Items
Degrees
Radians
Abs absvalue
NUM
Int int value
Round roundvalue , digit number of decimals
Ipart ipart value
Fpart fpart value
Gcd gcdnatural number, natural number
Min minlist
Max maxlist
Lcm lcmnatural number, natural number
RndInt rndIntminimum value, maximum value , number of trial
Remain natural number remain natural number
Prob
Random random number of trial
RndDice rndDice number of trial
RndCoin rndCoin number of trial
Conv
Angle
= 3.5 +
Basic Graphing Features Basic Keyboard
Basic Graphing Features Basic Keyboard
Graph Basics
Explanations of Various Graphing Keys
Zoom
To select a box area to zoom
EXP
Factor menu, press Eto activate the setup tool
Power
Factor
STO
Trig
RCL
Basic Graphing Features Basic Keyboard
Other Useful Graphing Features
Following illustration shows these relationships
Basic Graphing Features Basic Keyboard
Basic Graphing Features Basic Keyboard
Basic Graphing Features Basic Keyboard
Substitution feature
Example
Basic Graphing Features Basic Keyboard
Advanced Calculations Advanced Keyboard
Various Calculation Keys
Example
Calculate arctangent @t1 E
01 log2 log2 value
Calculations Using Math Menu
Equation, lower limit, upper limit , tolerance dx
Fminequation, lower limit of x, upper limit
Fmaxequation, lower limit of x, upper limit
Dxequation, value of x , tolerance
Cot value
∑ expression, initial value, end value , increment
Sec value
Csc value
Cosh-1cosh-1value
Sinh-1sinh-1value
Tanh-1tanh-1value
Rectangular/polar coordinate conversion
→dms value degrees →dms
Rθ→y rθ→yr coordinate, θ coordinate
Xy→r xy→rx coordinate, y coordinate
Xy→θ xy→θx coordinate, y coordinate
Rθ→x rθ→xr coordinate, θ coordinate
Advanced Calculations Advanced Keyboard
Or value a or value B
Value a and value B
Not not value
Conj conjcomplex number
Neg neg value
Xor value a xor value B
Xnor value a xnor value B
Abs abscomplex number
Calculations using complex numbers
Real realcomplex number
Image imagecomplex number
Functions available for complex number calculations
More Variables Single Value Variables and List Variables
Abs, round, ipart, fpart, int
Tool Menu
Advanced Calculations Advanced Keyboard
Setup Menu
Un = un-1⋅ 1 0.6 +
Advanced Graphing Features Advanced Keyboard
Advanced Graphing Features Advanced Keyboard
Advanced Graphing Features Advanced Keyboard
Graphing Parametric Equations
Use 3 in or 4 OUT of the a Zoom to adjust the drawing size
Draw a graph r = 16cosθsinθ
Polar Graphing
Based Time
Graphing Sequences
Based Web
Phase-based uv, uw, or vw
Example 1 n-based Graphing Time
Example 2 Phase-based Graphing uv
Example 3 n-1-based Graphing Web
Calc Function
Specific sub Menus Inflec
Advanced
Advanced keyboard specific sub-menus
Format Setting
Specific sub Menu items Menus
Zoom Functions
HYP
Polar coordinate system
Setting a Window
Rectangular coordinate system
Parametric coordinate system
Tables
Setting a table
101
Draw Function
Draw menu
Line
104
HLine Example
Hline
Vline
HLine y-value
Tline Example
Tline
VLine Example
Tlineequation, x-value
Shadeequation1, equation2 , lower value, upper
Draw
Draw equation
Shade
Circle Example
DrawInv DrawInv equation
Column and row definitions for text input
Text Textcolumn, row, strings
PxlONcolumn, row
PntON PntONx-coordinate, y-coordinate
PntOFFx-coordinate, y-coordinate
PntCHGx-coordinate, y-coordinate
DrawON DrawON equation number 1, .... or DrawON
PxlTST PxlTSTcolumn, row
DrawOFF DrawOFF equation number 1, .... or DrawOFF
RclGD RclGD number
StoGD StoGD number 0-9Saves the graph data Example
StoPict StoPict number 0-9Saves the pixel data Example
Substitution Feature
Create a new
Slide Show Feature
Slide Show
Enter x 3x 1x + 2 at the first equation
Playing back the newly created Slide Show
Select a file Select an image
Rearranging the captured images
Move
Slide Show menu
Specify
Insertion point
Rename
DEL
3x + 2y + z = 2x + 3y + z = 34 x + 2y + 3z =
Matrix Features
To edit
Dimensions
Problem
Select a matrix
Entering and Viewing a Matrix
Enter elements
Editing keys and functions
Matrix
Matrix + Matrix Matrix Matrix Matrix ⋅ Matrix Square
Normal Matrix Operations
Fill fillvalue, matrix name
Calculations using OPE menus
Special Matrix Operations
Dim dimmatrix name
Rndmat rndmatnumber of row, number of column
Identity identity dimension value
Cumul cumul matrix name
Augment augmentmatrix name, matrix name
Rowplus rowplusmatrix name, row number, row number
Rowswap rowswapmatrix name, row number, row number
Rowmult rowmultmultiplied number, matrix name, row number
Mat→listmatrix name, column number, list name
Mat→listmatrix name, list name 1, ..., list name n
List→mat list→matlist 1, .... list n, matrix name
RowEF rowEF matrix name
Calculations using Math menus
Det det matrix name
Trans trans matrix name
An expression
Use of menus
Concept Procedure
List Features
Enter each speed value in the list
Store the list
Equation using
Enter
Normal List Operations
Creating a list
Calculate Press @+@ Root of L2
SortD sortDlist name
Calculations using the OPE menu functions
Special List Operations
SortA sortAlist name
Natural number ⇒ dimlist name
Dim dimlist
Fill fillvalue, list
Dflist dflist list
Cumul cumul list
List→mat list→matlist 1, ..., list n, matrix name
Augment augmentlist 1, list
Mean meanlist , frequency list
Sum sumlist , start number, end number
Median medianlist , frequency list
Prod prodlist , start number, end number
Varian varianlist , frequency list
Drawing multiple graphs using the list function
Standard deviation and variance
StdDv stdDvlist , frequency list
StoLD StoLD natural number
Using Ldata functions
How to enter the list
Using List Table to Enter or Edit Lists
RclLD RclLD natural number
How to edit the list
Opening the list Press S Table to enter
Statistics & Regression Calculations
Data
Statistics & Regression Calculations
Whether
Setting
Graph drawing
Selecting
148
Stat menus
Statistics Features
Statistical evaluations available under the C Calc menu
Statistical calculations using the Monday data L3
Statistical calculations using the Sunday data L2
152
Histogram
Statistical graph types overview chart
Graphing the statistical data
Graph Types
Normal probability plot N.P Normal distribution plot N.D
Box plot Box Modified box plot MBox
Pie chart PIE Scatter diagram S.D XY Line Xyline
Statistical plotting on/off function
Specifying statistical graph and graph functions
Press DD Limit and press 22 LimON
Tracing
Trace function of statistical graphs
Graph
SetList SetList list name 1 , list name
Data list operations
SortA sortAlist
SortD sortDlist
Regression Calculations
161
162
15 x’ value or list x’
Using Regression Functions
16 y’ value or list y’
Press #CSD0404 Rgx2
Start a statisti Cal test Press see Test
Statistical Hypothesis Testing
About
Residual list
Zint1prop and 15 Zint2prop
167
168
169
170
171
172
Ztest1prop Tests the success probability P0 of a population
174
175
176
Distribution functions
InvNorm InvNormprobability , mean, standard deviation
07 cdfχ2 cdfχ2lower limit, upper limit, degree of freedom
CdfT cdfTlower limit, upper limit, degree of freedom
Freedom of denominator
181
Cdfgeo cdfgeosuccess probability, value
Cdfpoi cdfpoimean, value
Paper
Financial Features
Flow diagram on
Draw a cash
Payment due at the beginning of the period
Payment due at the end of the period
Press CC Period Press 11 PmtEnd and press E
Setting the payment due time
Simple interest and compound interest
Set the TAB FSE 2 and FIX Respectively
188
SlvPV N, I%, PMT, FV, P/Y, C/Y
Calc functions
Solvpmt N, I%, PV, FV, P/Y, C/Y
SlvI% N, PV, PMT, FV, P/Y, C/Y
190
Bal Bal number of payments , decimal place to round
Example using the 08 Calculations
11 →Apr →Apr effective interest rate, number of settlements
Conversion functions
12 →Eff →Eff nominal interest rate, number of settlements
Vars Menu
Three Analysis Methods Equation, Newton, and Graphic
Solver Feature
Equation
Solver Feature
Newton’s
197
198
199
Saving/Renaming Equations for Later Use
Recalling a Previously Saved Equation
Exec
Programming Features
Creating a new
Program
Programming Features
Programming Hints
Blank line
Command or
Storing a
Program line by
Comparison operands
Setting a variable
Variables
Operands
Print character strings
Programming commands
Command strings
Prgm menu PA
Following table
Rem Rem comments
Key variable
Is set to the corresponding numeric value as specified
Scrn menu PC
Brnch menu PB
O menu PD
Setup menu PE
Tab integer 0 to
Format menu PF
06 Y’ OFF Y’OFF
212
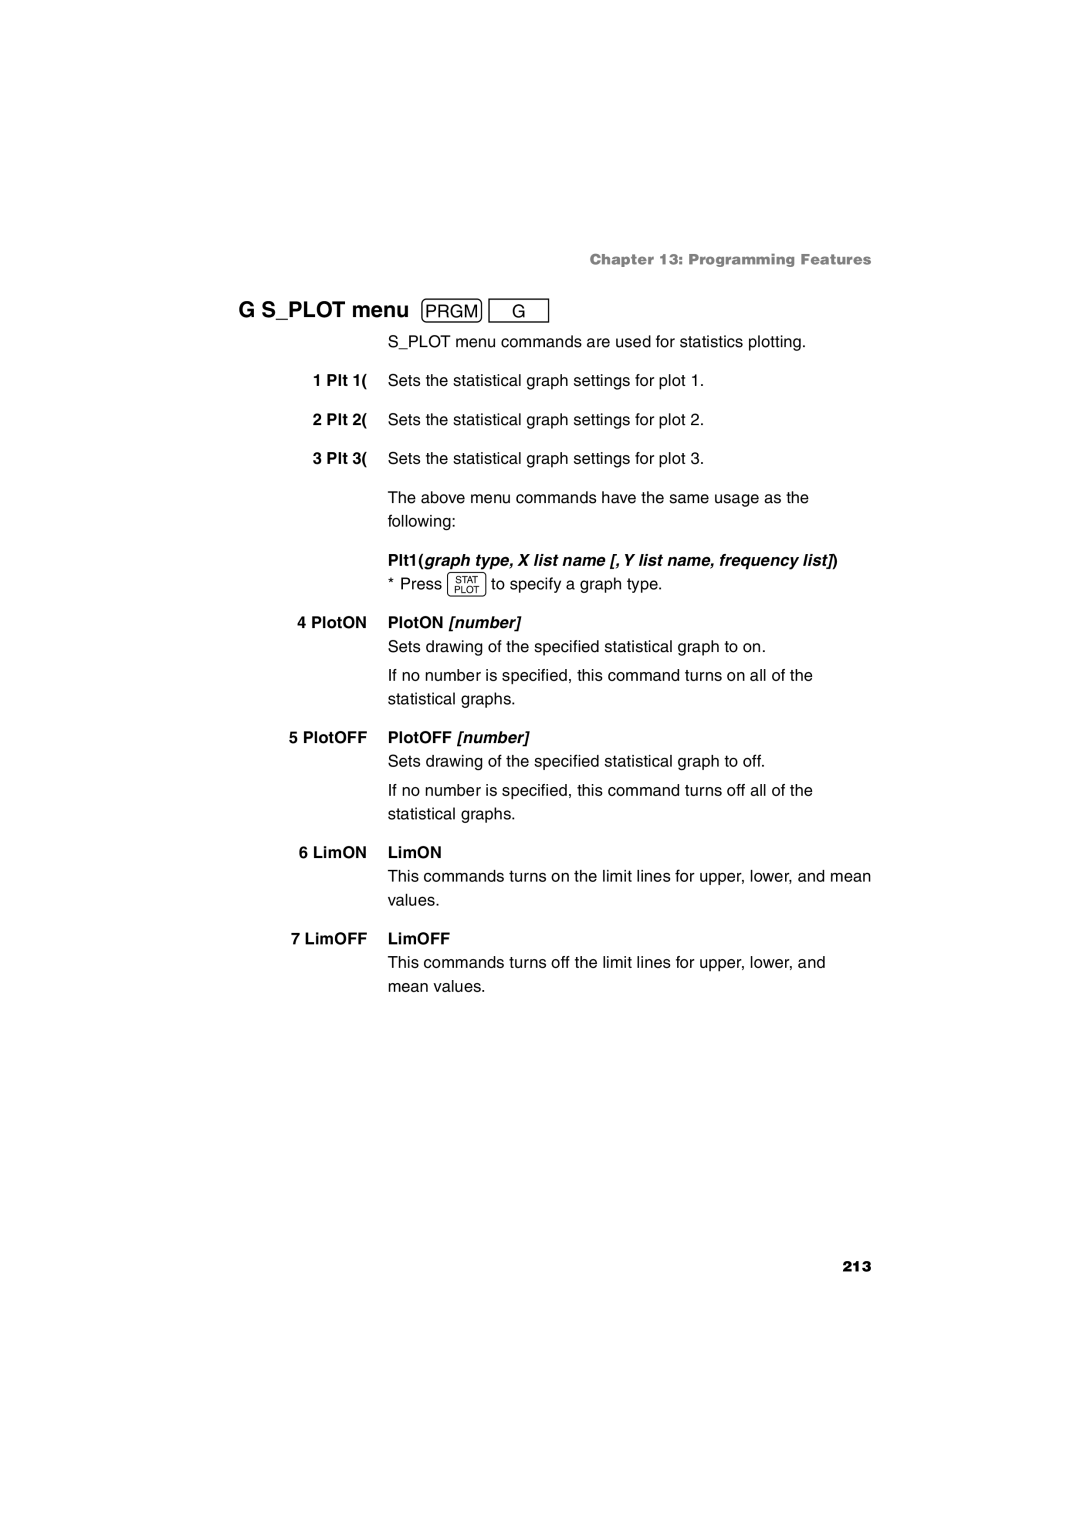
Plt1graph type, X list name , Y list name, frequency list
Splot menu PG
If If conditional statements Goto label name
Flow control tools
WEnd
Next
Copy menu PH
Other menus convenient for programming
Vars menu
Value
Debugging
Sample programs
When an infinite Loop occurs
Matfill
221
Checking the memory usage
Accessing the Option Menu
Adjusting the screen contrast
Option Menu
Created
Linking to another EL-9900 or PC
Deleting files
225
226
Transmission between the EL
Reset function
Replacing Batteries
Appendix
Handling
Replacing unit
Procedures for
Operation
230
Graph cannot be seen
Troubleshooting Guide
Calculator’s power won’t turn on
Saved calculator configurations are not retained
Screen images cannot be stored Slide Show
Specifications
Power supply
Substitution features
Slide Show features
Program features
Error Codes and Error Messages
Break
PV calculation
Error Conditions Relating to Specific Tasks
Financial
% calculation
PMT calculation
FV calculation
Distribution function
Error conditions during financial calculations
Df = However Γs = 0 x s 1 e x dx Df Degree of freedom
Arithmetic calculation
Calculation Range
Function calculation
Function Calculation range ⋅ 10-99≤ x 1 ⋅ Ln x = loge Log
Xy → θ = tan-1
Function Calculation range Σx 1 ⋅
Complex number calculation
Catalog Feature
Math menus
List of Menu/Sub-menu Items
Mcalc
Mangle
Mnum
Mprob
Mconv
Mcomplex
List menus
Mineq
Mlogic
@lLDATA
@lMATH
Scalc
SEDIT/OPE
Sreg
Sdistri
Stest
Stat Plot menus
Stat Plot mode HIST/B.L./N.P./N.D./BOX/PIE/S.D./XYLINE
PLOT1/PLOT2/PLOT3/LIMIT/ON/OFF
@dDRAW
Draw menus
Zzoom
Zoom menus
@dPOINT
@dON/OFF/LINE/GDATA/PICT/SHADE
FACTOR/POWER
ZHYP/STO/RCL
Calc menus
@kCALC
Prgm menus
Pin the Prgramming mode Prgm
Pin the Prgramming mode Brnch
Slide Show menus
Pin the Prgramming mode I/O
Pin the Prgramming mode Scrn
Pin the Prgramming mode Setup
Pin the Prgramming mode Splot
Pin the Prgramming mode Format
@mEDIT
Pin the Prgramming mode Copy
Matrix menus
@mNAME
@mMATH
Finance menus
@gSOLVER/CALC
@VN BASE/SYSTEM/POLY
Tool menus
@gPERIOD
@gVARS
Solver menus
@in the Solver mode METHOD/EQTN/SAVE/RENAME
Index
266
267
268
269
270
271
272
Europe
Sharp Corporation