2.PERFORMANCE CURVES
7300
1200
1000
800
A
I
s
600 e
3
E
3
0
400
200
1 | 2 | 3 | 4 | 5 | 6 | 7 | 9 | 10 | 11 |
CURRENT(A)
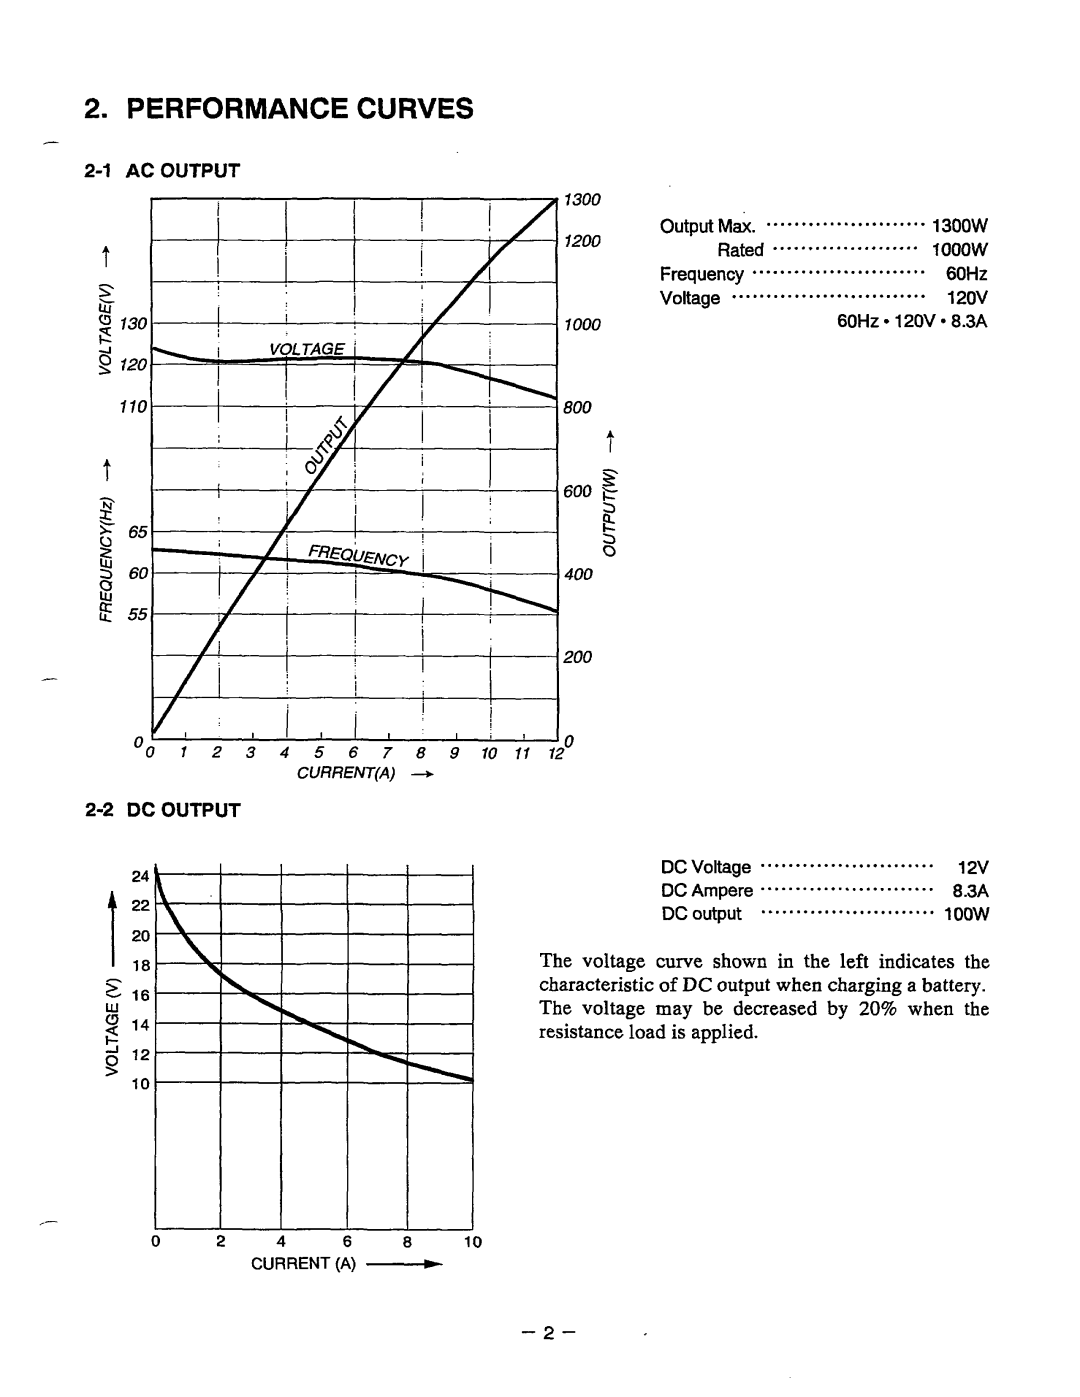
Thevoltage curve shownin the left indicates the characteristic of DC output when charging a battery. The voltagemay be decreased by 20% when the resistance loadis applied.
”0 2 4 6
CURRENT (A)
- 2 -