period two
Sound Perception and
Rating Methods
notes
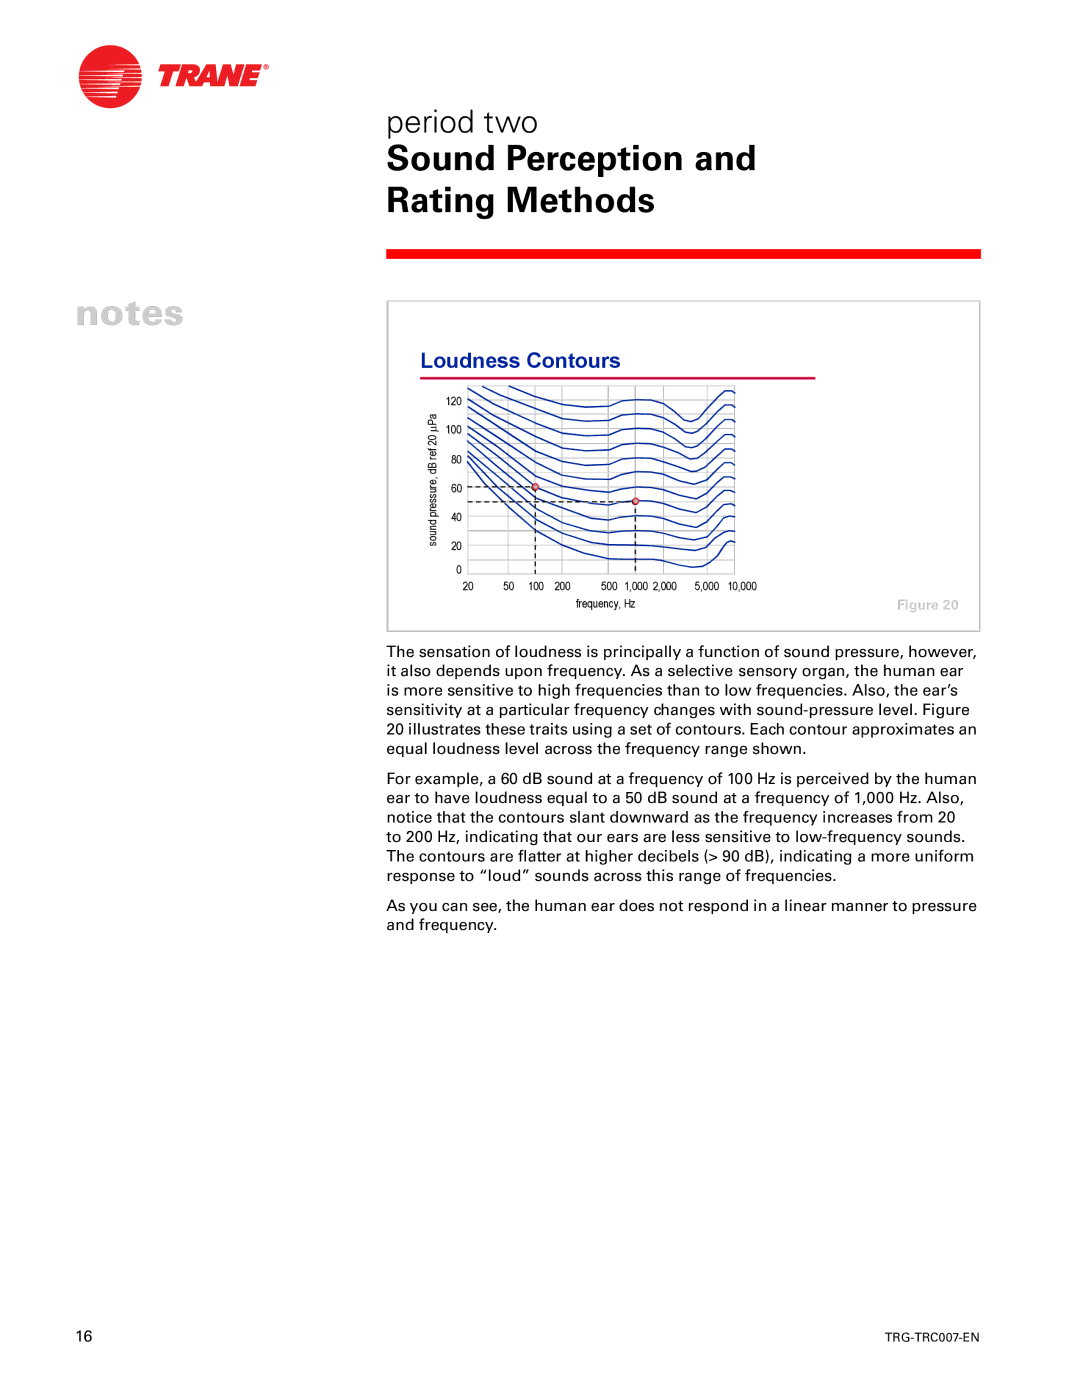
Loudness Contours |
|
|
| |||||
| 120 |
|
|
|
|
|
|
|
mPa | 100 |
|
|
|
|
|
|
|
ref 20 |
|
|
|
|
|
|
| |
80 |
|
|
|
|
|
|
| |
dB |
|
|
|
|
|
|
| |
|
|
|
|
|
|
|
| |
pressure, | 60 |
|
|
|
|
|
|
|
|
|
|
|
|
|
|
| |
sound | 40 |
|
|
|
|
|
|
|
20 |
|
|
|
|
|
|
| |
|
|
|
|
|
|
|
| |
| 0 |
|
|
|
|
|
| 10,000 |
| 20 | 50 | 100 | 200 | 500 | 1,000 2,000 | 5,000 | |
|
|
|
|
| frequency, Hz |
| Figure 20 | |
The sensation of loudness is principally a function of sound pressure, however, it also depends upon frequency. As a selective sensory organ, the human ear is more sensitive to high frequencies than to low frequencies. Also, the ear’s sensitivity at a particular frequency changes with
For example, a 60 dB sound at a frequency of 100 Hz is perceived by the human ear to have loudness equal to a 50 dB sound at a frequency of 1,000 Hz. Also, notice that the contours slant downward as the frequency increases from 20 to 200 Hz, indicating that our ears are less sensitive to
As you can see, the human ear does not respond in a linear manner to pressure and frequency.
16 |
|