period two
Sound Perception and Rating Methods
A–Weighting Example
octave | center | actual sound | | A-weighting | A-weighted | |
| |
band | frequency (Hz) | pressure (dB) | | factor (dB) | sound pressure (dB) | |
1 | 63 | 63 | | – 26 | 37 | |
2 | 125 | 52 | | – 16 | 36 | |
3 | 250 | 45 | | – 9 | 36 | |
4 | 500 | 38 | | – 3 | 35 | |
5 | 1,000 | 31 | | + 0 | 31 | |
6 | 2,000 | 24 | | + 1 | 25 | |
7 | 4,000 | 16 | | + 1 | 17 | |
8 | 8,000 | 10 | | + 0 | 10 | |
| | | | | 42 dBA | Figure 24 |
| | | | |
| | | | | |
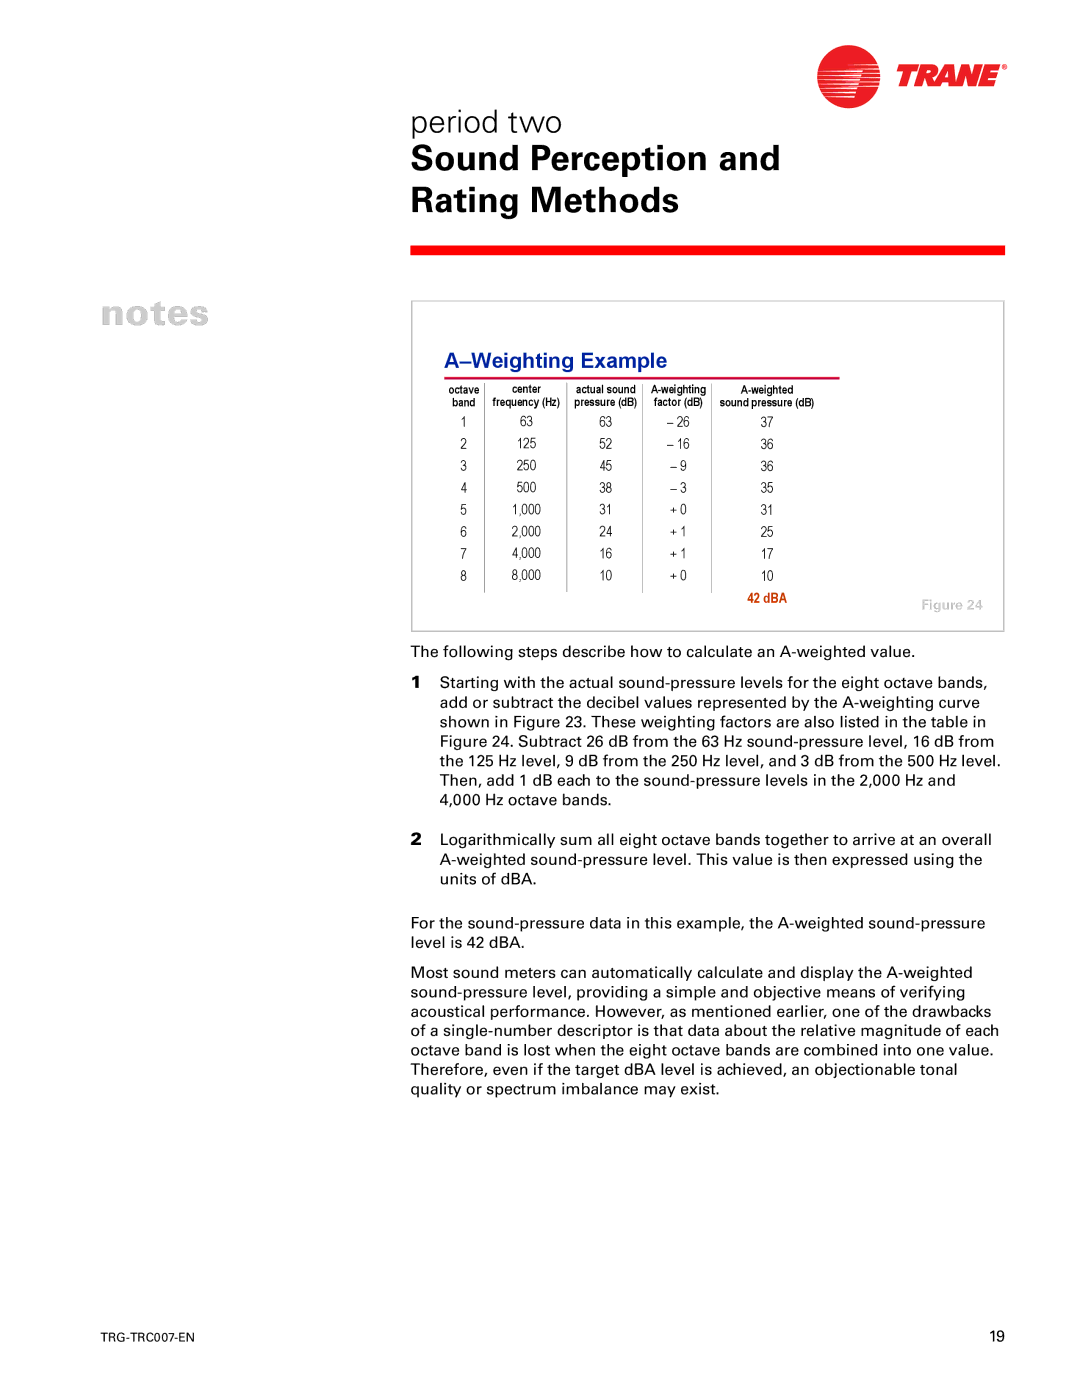
The following steps describe how to calculate an A-weighted value.
1Starting with the actual sound-pressure levels for the eight octave bands, add or subtract the decibel values represented by the A-weighting curve shown in Figure 23. These weighting factors are also listed in the table in Figure 24. Subtract 26 dB from the 63 Hz sound-pressure level, 16 dB from the 125 Hz level, 9 dB from the 250 Hz level, and 3 dB from the 500 Hz level. Then, add 1 dB each to the sound-pressure levels in the 2,000 Hz and 4,000 Hz octave bands.
2Logarithmically sum all eight octave bands together to arrive at an overall A-weighted sound-pressure level. This value is then expressed using the units of dBA.
For the sound-pressure data in this example, the A-weighted sound-pressure level is 42 dBA.
Most sound meters can automatically calculate and display the A-weighted sound-pressure level, providing a simple and objective means of verifying acoustical performance. However, as mentioned earlier, one of the drawbacks of a single-number descriptor is that data about the relative magnitude of each octave band is lost when the eight octave bands are combined into one value. Therefore, even if the target dBA level is achieved, an objectionable tonal quality or spectrum imbalance may exist.

