period two
Sound Perception and Rating Methods
Octave-Band Rating Method
octave | | center | | equipment | | sound pressure |
| | |
| | sound power | | in the space |
band | | frequency (Hz) | | (dB ref 10-12W) | | (dB ref 20 mPa) |
1 | | 63 | | 103 | | 63 |
2 | | 125 | | 104 | | 52 |
3 | | 250 | | 100 | | 45 |
4 | | 500 | | 101 | | 38 |
5 | | 1,000 | | 98 | | 31 |
6 | | 2,000 | | 93 | | 24 |
7 | | 4,000 | | 88 | | 16 |
8 | | 8,000 | | 85 | | 10 |
Figure 32
Octave-Band Rating Method
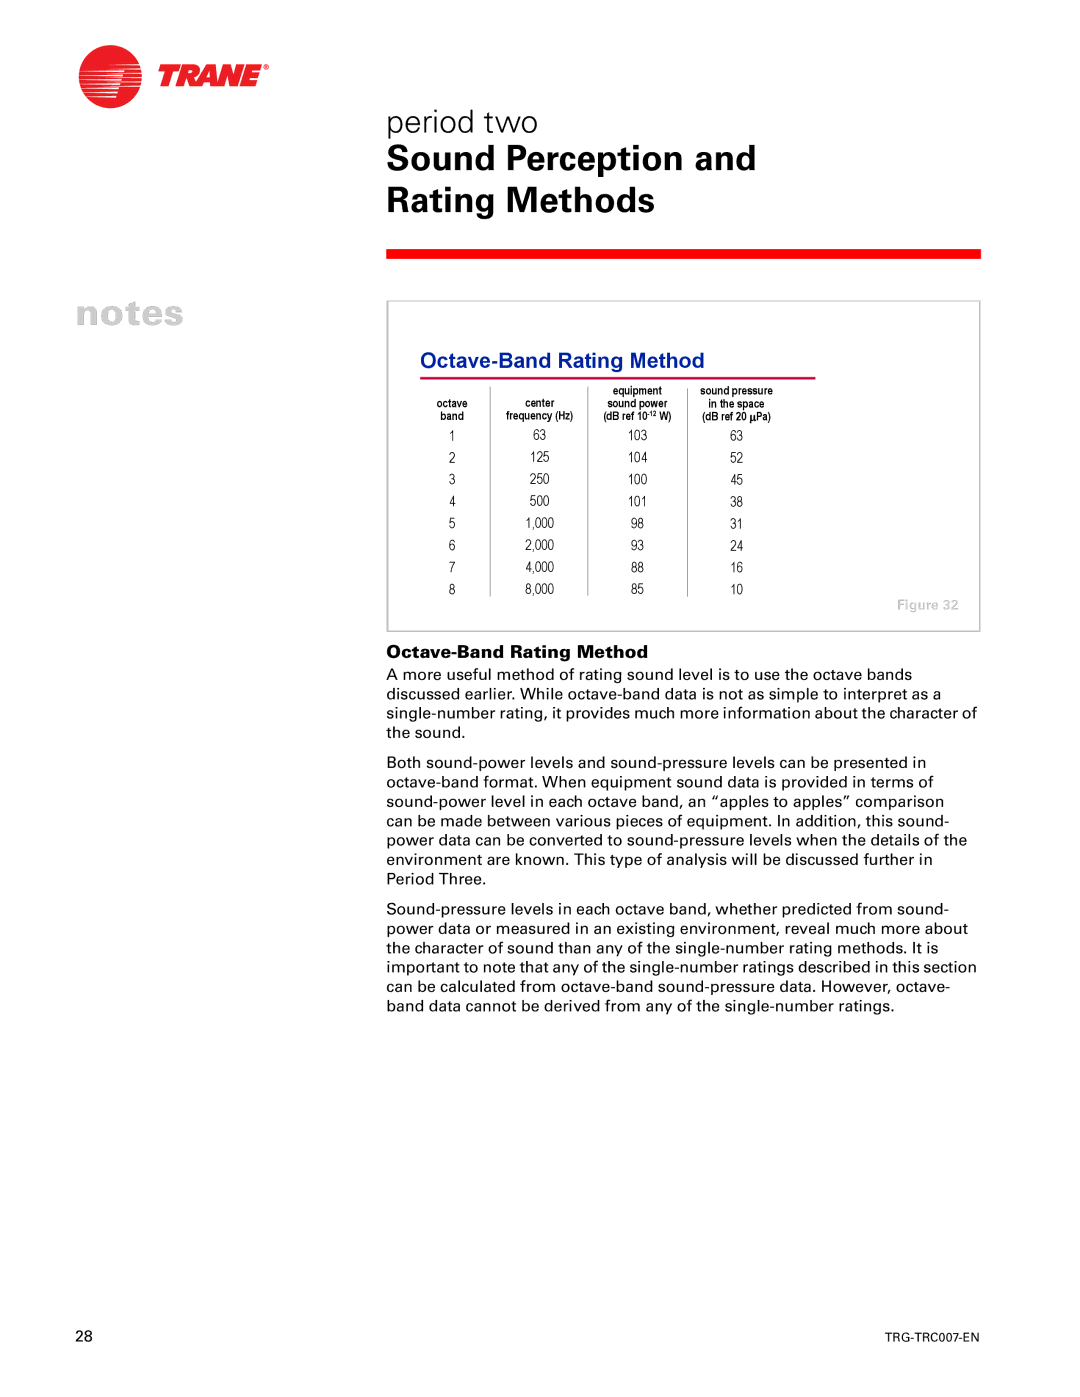
A more useful method of rating sound level is to use the octave bands discussed earlier. While octave-band data is not as simple to interpret as a single-number rating, it provides much more information about the character of the sound.
Both sound-power levels and sound-pressure levels can be presented in octave-band format. When equipment sound data is provided in terms of sound-power level in each octave band, an “apples to apples” comparison can be made between various pieces of equipment. In addition, this sound- power data can be converted to sound-pressure levels when the details of the environment are known. This type of analysis will be discussed further in Period Three.
Sound-pressure levels in each octave band, whether predicted from sound- power data or measured in an existing environment, reveal much more about the character of sound than any of the single-number rating methods. It is important to note that any of the single-number ratings described in this section can be calculated from octave-band sound-pressure data. However, octave- band data cannot be derived from any of the single-number ratings.

