period two
Sound Perception and
Rating Methods
notes
Room Criteria (RC) Curves
| 80 | A |
|
|
|
|
|
|
|
mPa | 70 | B |
|
|
|
|
|
|
|
60 |
|
|
|
|
|
|
|
| |
dB ref 20 |
|
|
|
|
|
|
|
| |
50 |
|
|
| D |
|
|
|
| |
pressure, | 40 |
|
|
|
|
|
| ||
|
|
|
|
|
|
| |||
|
|
|
|
|
|
| E | ||
|
|
|
|
| C | ||||
sound | 30 |
|
|
|
| ||||
20 |
|
|
|
|
|
|
| ||
|
|
|
|
|
|
|
| ||
|
|
|
|
|
|
|
|
| |
| 10 |
|
|
|
|
|
|
| |
| 31.5 | 63 | 125 | 250 | 500 | 1,000 | 2,000 | 4,000 | |
|
| ||||||||
Figure 30 |
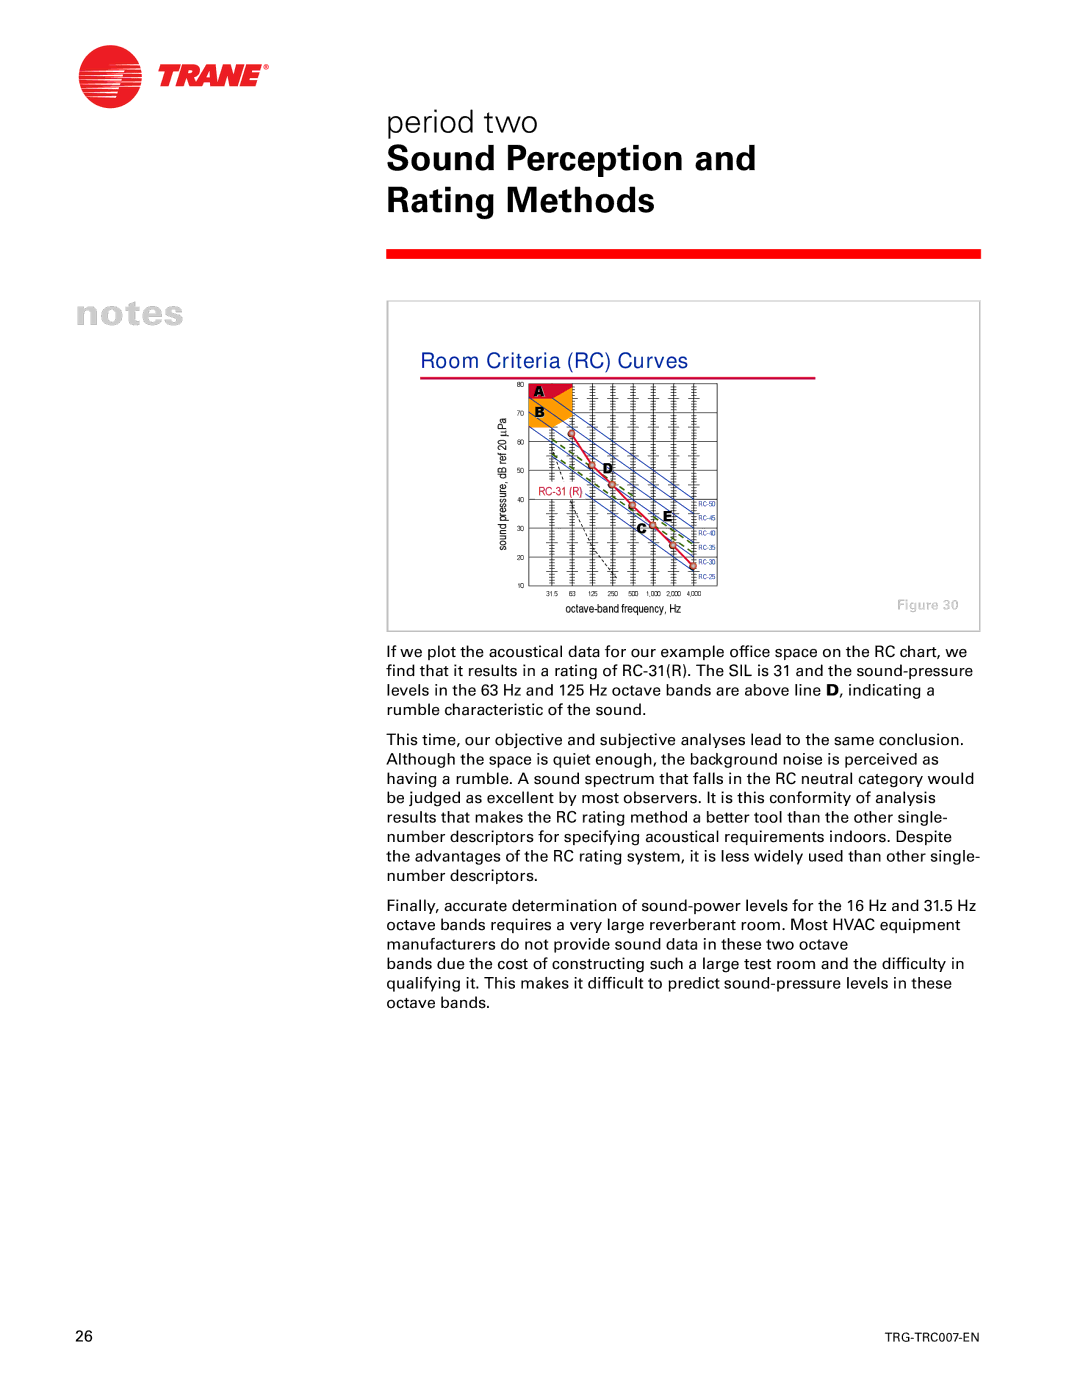
If we plot the acoustical data for our example office space on the RC chart, we find that it results in a rating of
This time, our objective and subjective analyses lead to the same conclusion. Although the space is quiet enough, the background noise is perceived as having a rumble. A sound spectrum that falls in the RC neutral category would be judged as excellent by most observers. It is this conformity of analysis results that makes the RC rating method a better tool than the other single- number descriptors for specifying acoustical requirements indoors. Despite the advantages of the RC rating system, it is less widely used than other single- number descriptors.
Finally, accurate determination of
bands due the cost of constructing such a large test room and the difficulty in qualifying it. This makes it difficult to predict
26 |
|
