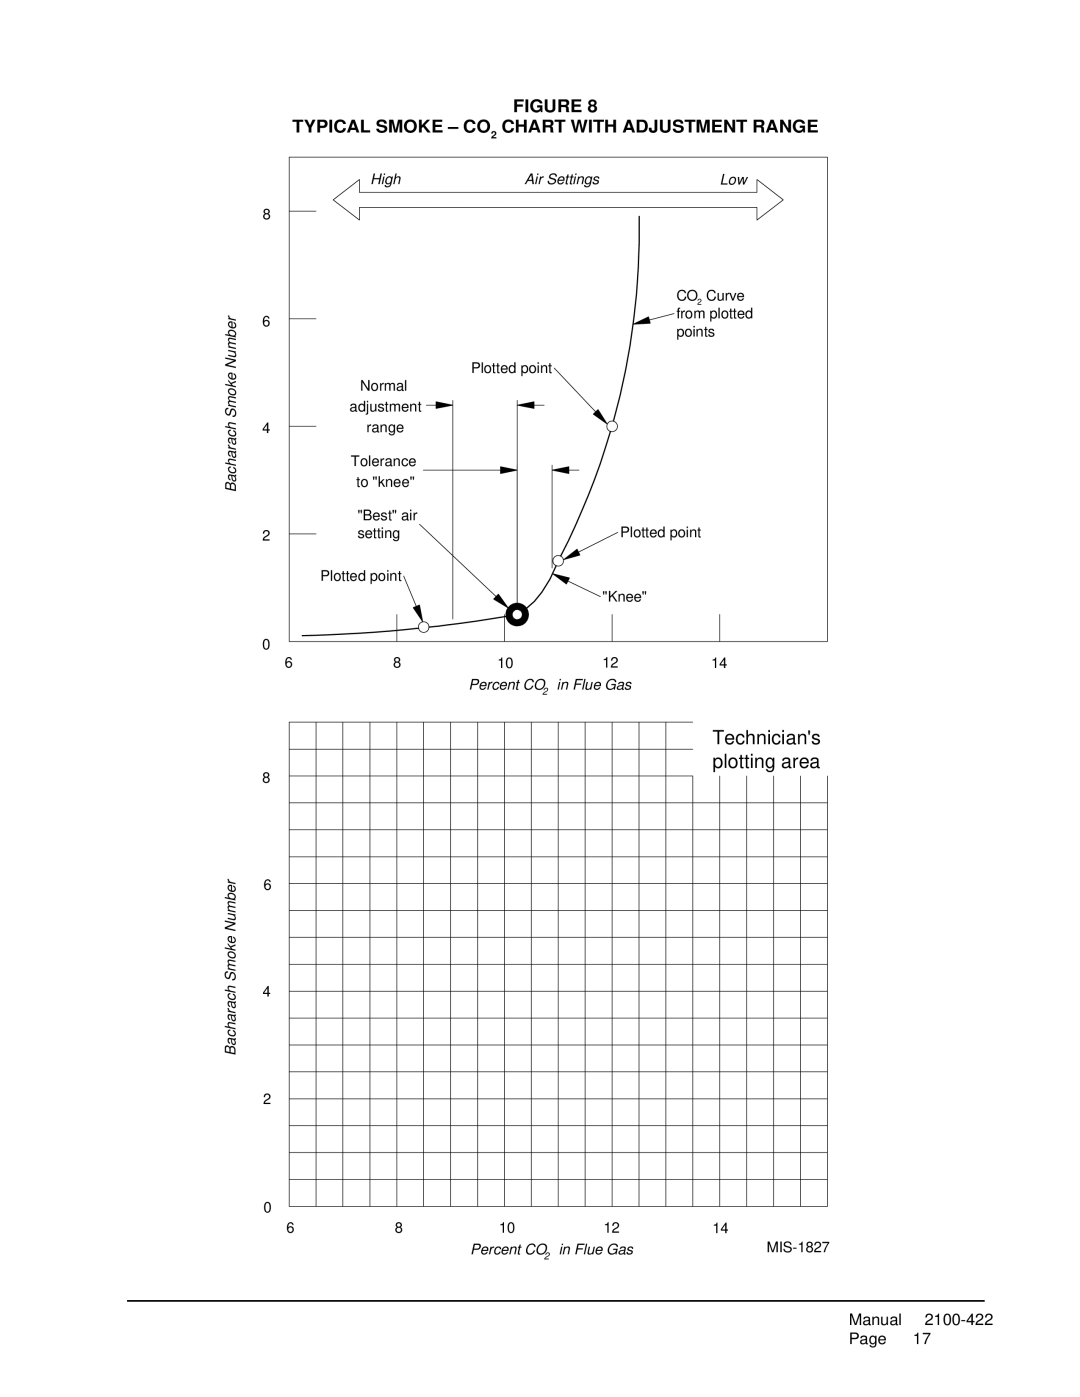
FIGURE 8
TYPICAL SMOKE – CO2 CHART WITH ADJUSTMENT RANGE
High | Air Settings | Low |
8
Bacharach Smoke Number
CO2 Curve
6from plotted points
Plotted point
| Normal |
| adjustment |
4 | range |
| Tolerance |
|
|
|
| to "knee" |
|
|
|
| "Best" air |
| Plotted point |
|
2 | setting |
|
| |
| Plotted point |
|
|
|
|
|
| "Knee" |
|
0 |
|
|
|
|
6 | 8 | 10 | 12 | 14 |
|
| Percent CO2 | in Flue Gas |
|
Bacharach Smoke Number
Technician's plotting area
8
6
4
2
0
6 | 8 | 10 | 12 | 14 |
|
| Percent CO2 | in Flue Gas |
Manual
