Page
Copyright Notice
Barracuda NG Network Access Client
VPN Component Configuration
Update or Migration
Uninstall
VPN Configuration
802.1X Technical Guideline
Pre-Connector and Remote VPN
Example Configuration
Warranty and Software License Agreement
Introduction to Barracuda NG Network Access Client
Endpoint Security and Network Access Control
Introduction
Barracuda NG Personal Firewall
Client software consists of the following subsystems
1Barracuda NG Network Access Client environment
What can Barracuda NG Network Access Client be used for?
Barracuda NG Network Access Client Administrator’s Guide
Licensing Aspects
What is a Policy Rule Set?
Policy Matching Procedure
Healthy Limited Access VPN Offline
Barracuda NG Network Access Client Administrator’s Guide
Probation actions
Healthy
Current User context
Local Machine context
VPN context
Matching Criteria Local Machine Current User
Health Matching
Health State Unhealthy
Health State Untrusted
Health State Probation
Health State Healthy
Health State Requirements
Analyse Enforce Monitor
Border Patrol
3Trust Relationships
System Health Validator
Server Config Access Control Service
Access Control Service Settings
General
ParameterDescription
Trustzone-Border
Remediation Service
Log Level
Advanced
Number of used Threads
General
Access Control Objects
Pictures
Welcome Messages
Personal Firewall Rules
3Access Control Objects Access Control Service Bitmaps
Registry Check Objects
Click clipboard, import the adequate registry file
Import of a registry file
7Access Control Service Trustzone Configuration tree
Access Control Service Trustzone
Servername Assigned Services servicename ACS
Rules
9Access Control Service Trustzone Rules
Time Restriction
Policy Name
Deactivate Policy
Client Connection External Ignore Internal
Group Patterns
Net Bios
User Login
Policy Matching All-of-following One-of-following
X509
X509 Issuer
Microsoft
X509 Subject
Required Health State Basic
Antispyware Required Scanner On
Last AS Scan Action Manual Auto Remediation
AS Engine Required Ignore Latest default Previous Last-2
Last AV Scan Action Manual Auto Remediation
Tries to execute a full system scan automatically
AV Engine/Pattern Manual Action Auto Remediation
Update automatically
Parameter Description
Message
Personal Ruleset Name Firewall Settings
Software Yes Update No default Required Yes-Even-Major
Server
Healthy Vlan Id
Settings
802.1X Use
Use Dhcp renew
Ruleset Name Limited Access Message
Limited Access
Bitmap
802.1X
Health Passport
Verification Key
Passport Verification Key
Support Chart
Rule Set Name Tab
Server Config Personal Firewall Rules
Double-click the appropriate VPN Firewall Rule Set
1Rules Incoming
Rules Incoming / Outgoing
Paste
New…
Delete
Copy
Inactive
Select New… from the context menu to create a new rule
Item / Parameter Description
Comment
Section Description
Tester
Tester view allows testing rule sets for consistency
Test Report
Following entities are available for rule testing
Options
With Adsl Pptp
Port Protocol Service Name Description
Icmp Parameters
Connect to the Internet
Following objects assigned with status multi are available
Preconfigured
Adapters
Listing is divided into the following columns
Name Specify a name for the adapter object
Following further adapter objects are available
Adapter/Ref
Trust Type
Status
IPs
10User Object dialog
User Objects
11Network Objects window
Net Objects
This object includes the Multicast network 239.255.0.0/16
12Net Object dialog
Click New… to open the Net Object dialog
13Service Object dialog
Service Objects
Application Objects
Service Name Port Protocol Connection Description
Kerberos
14Application Object dialog
Application Connection Description
HKEYLOCALMACHINE\Services registry key
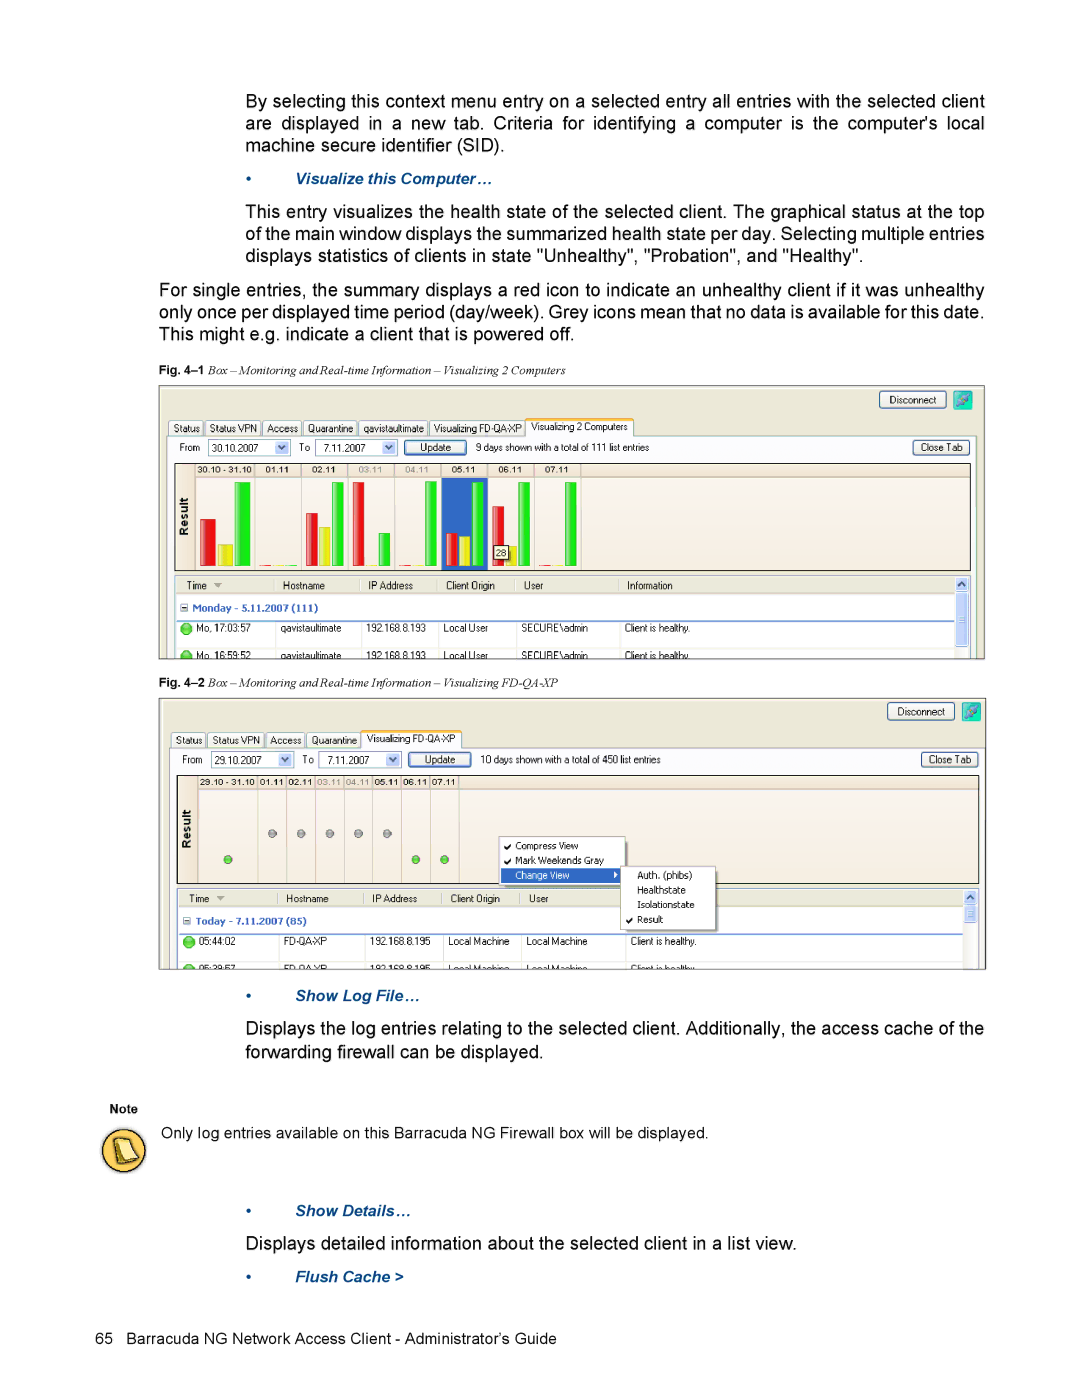
Box Monitoring and Real-time Information
Operating & Monitoring Barracuda NG NAC
Available Columns
Clients MAC address as reported by the NG client
Possible values are Access, Not Restricted, or Probation
Filtering
Name of the matching policy rule
Context Menus
Visualize this Computer…
3Box Monitoring and Real-time Information Show time in UTC
Status Tab
Status VPN Tab
Access Tab
Quarantine Tab
Double-click setup.exe to start the installation routine
Client Installation
Installation routine offers three basic ways of setup
See 5.3 Unattended Setup,
Complete Installation
See 5.4 Customer Setup,
802.1x Enable Dhcp Renew
Custom Installation
Unattended Setup
Parameter Default
See description for parameter Windows File Sharing,
See description for parameter Trusted Network,
This option prevents deactivating the NG Personal Firewall
This parameter defines the Access Control Server to be used
See 5.4.1 customer.inf,
Customer Setup
Proceed as follows to prepare a completely customized setup
Customer.inf
Directive Comment
Optionally, the following file-directives may be detailed
0x00001000
0x00000800
0x00000008
0x00000010
Flags
Reg-root
Subkey
Value-entry-name
Edit profile name
Subdir
Silent.cmd
Filename
Diskid
For an overview of specific properties see -1,
Refer to the OS help for details
System Restore
Update or Migration
Procedure
Uninstall
Overview
VPN Configuration
Facts and Figures
Function Comment
Function Supported
Usage Scenario
Architecture
Barracuda NG Personal Firewall
All Programs Barracuda NG Network Access Client NG Firewall
1Windows 7 Windows Firewall and Action Center screens
Integration within Windows
2Rule set selection
Rule Set Selection
3Graphical Interface of the Barracuda NG Personal Firewall
User Interface
Firewall Menu
General Firewall Settings and Tasks Menu Bar
Block all IP Fragments
This tab allows you to configure blocking of Icmp packets
Disable Windows Firewall
Automatic Adapter Assignment
Connect Close Block
View Menu
Load Display
Security Mode Menu
Summary
NG Control Center Monitoring Firewall Activities
Events
11NG Control Center History window
History
Add Pass Rule
Show Details
Resolve Source/Destination IP
Send to Rule Tester
Filters incoming or outgoing connections
Filters the connection’s Traffic Policy
Filters the source IP address of the connection
Filters the application which has attempted to connect
Live Activity view details all currently active connections
Live Activity
Disconnect
Filter Conditions
Configuration
Current State Setting the Security Mode
Show Users
Show Source Addresses…
Show Destination Addresses…
Show Adapters
Paste Pastes the selected rules from the clipboard
ItemDescription
Application optional
Action Name Comment
Inactive checkbox Select
Source / Destination
18Time restriction dialog
Monitor Connections Yes
19Adapter objects window
Adapters
Control Network Connections
Network Connection name for example, Local Area Connection
Following options are available
Networks
Untrusted
Secured Routes are assigned to the Net-NGVPNObject
22Net Object dialog
Services
Example
Applications
24Application Object dialog
10Applications required in Microsoft Windows domains
25User Object dialog
Users
Rule Tester
Rule Tester view allows testing rule sets for consistency
27Test Report window
Test Reports
Following options are available for customisation
Administration Firewall Settings Wizard
However, it will not pop up if
Automatic Adapter Configuration
28Security Alert windows
Automatic Rule Configuration
Restrictive rule set only
29Security Alert Advanced Policy
Create a New Profile Using the Profile Wizard
VPN Component Configuration
2VPN Profile Wizard Profile Wizard
4VPN Profile Wizard Enter personal License
6VPN Profile Wizard Modify Existing Profile Using the Wizard
Configure a New Profile Manually
8NG VPN client Connect dialog
Field where characters need to be inserted
11Editing options of the VPN client dialog
Shows the version information
13Close NG VPN Client informational window
Barracuda NG VPN Client’s Menu Bar
Closes the NG VPN Client window
Connection Dialog
NG VPN Client can be started in the following ways
Click Connect to establish a connection to the VPN server
Assigned Wins address
Status Dialog
Assigned domain
Assigned DNS IP address for the VPN connection
Local time on the VPN server
Enable or disable compression
Uptime for the current connection
VPN server to which the client currently is connected
16Message dialog window
Message Dialog
Name of the profile
VPN Profiles Configuration Window
Configured VPN server to connect to
Barracuda Networks Control / Preferences Dialog
Use this menu item to terminate a connection
Certification Authorities Configuration Window
Store into which the certificate was saved
Modify, copy or delete an existing profile
Opens a window with detailed certificate information
Configure specific Barracuda NG VPN adapter settings here
Deletes the selected certificate from the certificate store
General VPN Settings section Direct Access
19Connection Entries tab
Connection Entries Tab
Following parameters are available for X509 authentication
Barracuda Authentication
DescriptionDescription
Advanced Settings Tab
External File Path to the external X.509 certificate
Default Yes
Virtual Adapter Configuration
Default Direct assignment
Use Access Control Service
Be established
Disconnecting. Recommended value No
Enable MS Logon
Fallback Profile
IP address of the VPN server
User name possibly needed for proxy authentication
URL or IP address of the proxy server
Log entry’s time stamp
Log Window
Module the respective log entry refers to
Access Monitor
Barracuda NG Access Monitor
Port Security
Health Agent
Monitoring
Property Description
Advanced Status information
State Description
5Connection error using Icmp connectivity checking see
Barracuda NG Network Access Client Administrator’s Guide
Task Description
11.2.6 802.1X Authentication Port Security
Column Description
EAP Tracer
Use Ntml Authentication
Access Control Server IPs from Registry
Access Control Server IPs from Dhcp
Use Basic Authentication
Item Description
Health Agent Connectivity
Value
Key
Health Agent Authentication
Ieee 802.1X Authentication
11.3.9 802.1X Settings
Capture 802.1X Traffic EAP
Log Files
Log Settings
16 Log Files Description
DownloadLocal.xml
Client.xml
Connect.xml
Download.xml
VPN Connector
Pre-Connector and Remote VPN
Create a connector to achieve following
Thereafter rename the default profile
Creating a Connector
Remote Domain Logon Pre-Logon
Remote VPN rvpn
Same example with 10 retries for connecting -c
Connection Procedure
Dhcp
1Example configuration environment
Example Configuration
Personal Firewall Rule Set
Introduce Access Control Objects
Next create and edit the unrestricted rule set
Introduce an Access Control Service Trustzone
Page
Policy Rule dialog is split up into these views
Configure an Access Control Service Trustzone
Barracuda NG Network Access Client Administrator’s Guide
Parameter Value
Page
Example Configuration
Configure Forwarding Firewall Rule Set
Example Configuration
Client computer
Switch
Authentication Server
802.1X Technical Guideline
EAP Packet Tracer
Access Control Server
Disabled Enabled
Status Monitoring
Supplicant console interface
Using the Barracuda NG Access Monitor for Analysis
Command Description
Log Files on the Client Computer
Path
Switch Web Interface
These values are described in more details on
Key Logging
See 14.3.11 Authentication Message Exchange,
See 14.3.9 Periodic client re-authentication by the switch,
Ethernet
Authentication
Switch Console Interface
Example enabling debug output
Point-to-Point
Operational Sequence
Start up
Token Ring
WZO prior to Windows Vista
Service Friendly Name Service Name
Dot3svc Windows Vista
Wpa-supplicant configuration
Successful start of the wpa-supplicant can be verified by
To resolve this problem proceed following steps
Runtime
You will require elevated privileges to perform this step
Return to privileged Exec mode
Enter global configuration mode
Verify your entries
Example
Re-authentication started by the switch is illustrated
Condition Description
Command
Enter the global configuration mode
See for the Eapol packet frames
Dhcp Renew
Return to the privileged Exec mode
Resetting the 802.1X Authentication process
14 phions.log Output
Shutdown
15 phions.log Output
Table shows an Eapol packet frame
Addendum
Packets
WPA Supplicant Log File Identifiers
200 802.1X Technical Guideline
Sending / receiving commands over pipe
202 802.1X Technical Guideline
Additionally following tools have been used for analysis
Known Issues using Cisco Catalyst 3750-E Switch
Wireshark
Engineering Environment
No aaa accounting dot1x default group radius
Appendix
Customer Install Files
Appendix
Barracuda NG Network Access Client Administrator’s Guide
Appendix
VPN Profile Registry Keys
VPN Profile Registry Keys
3DES AES
Profile Registry Keys
FAQs
Appendix
Configuration Parameters
214
Reconnect immidiately 10
X509 Altnames 2 X509 Issuer 2 X509 Subject 2
15.6 Parameter Lists
Introduction Server Config Access Control Service
Barracuda NG Access Monitor
Figures
220
802.1X Technical Guideline
Barracuda Networks Software License Agreement
Barracuda Networks Limited Hardware Warranty
Barracuda Networks Warranty and Software License Agreement
Page
Barracuda Networks Software License Agreement Appendix
Page
Page
No Warranty
Terms and Conditions
Page
Page
Page
Page
Limitation of Liability
Page
Page
Page
238
Page
Page
Page
Page
Disclaimer of Warranty
Miscellaneous
Page
Limits
Terms and Conditions for USE, REPRODUCTION, and Distribution
Page
Page
Page
Page
252
Page
Page
Barracuda Networks Warranty and Software License Agreement
Page
Barracuda Networks Warranty and Software License Agreement
Page
Barracuda Networks Warranty and Software License Agreement
Page
Page
Issue Date Aug 6 262
Page
264