GP-1610CF specifications
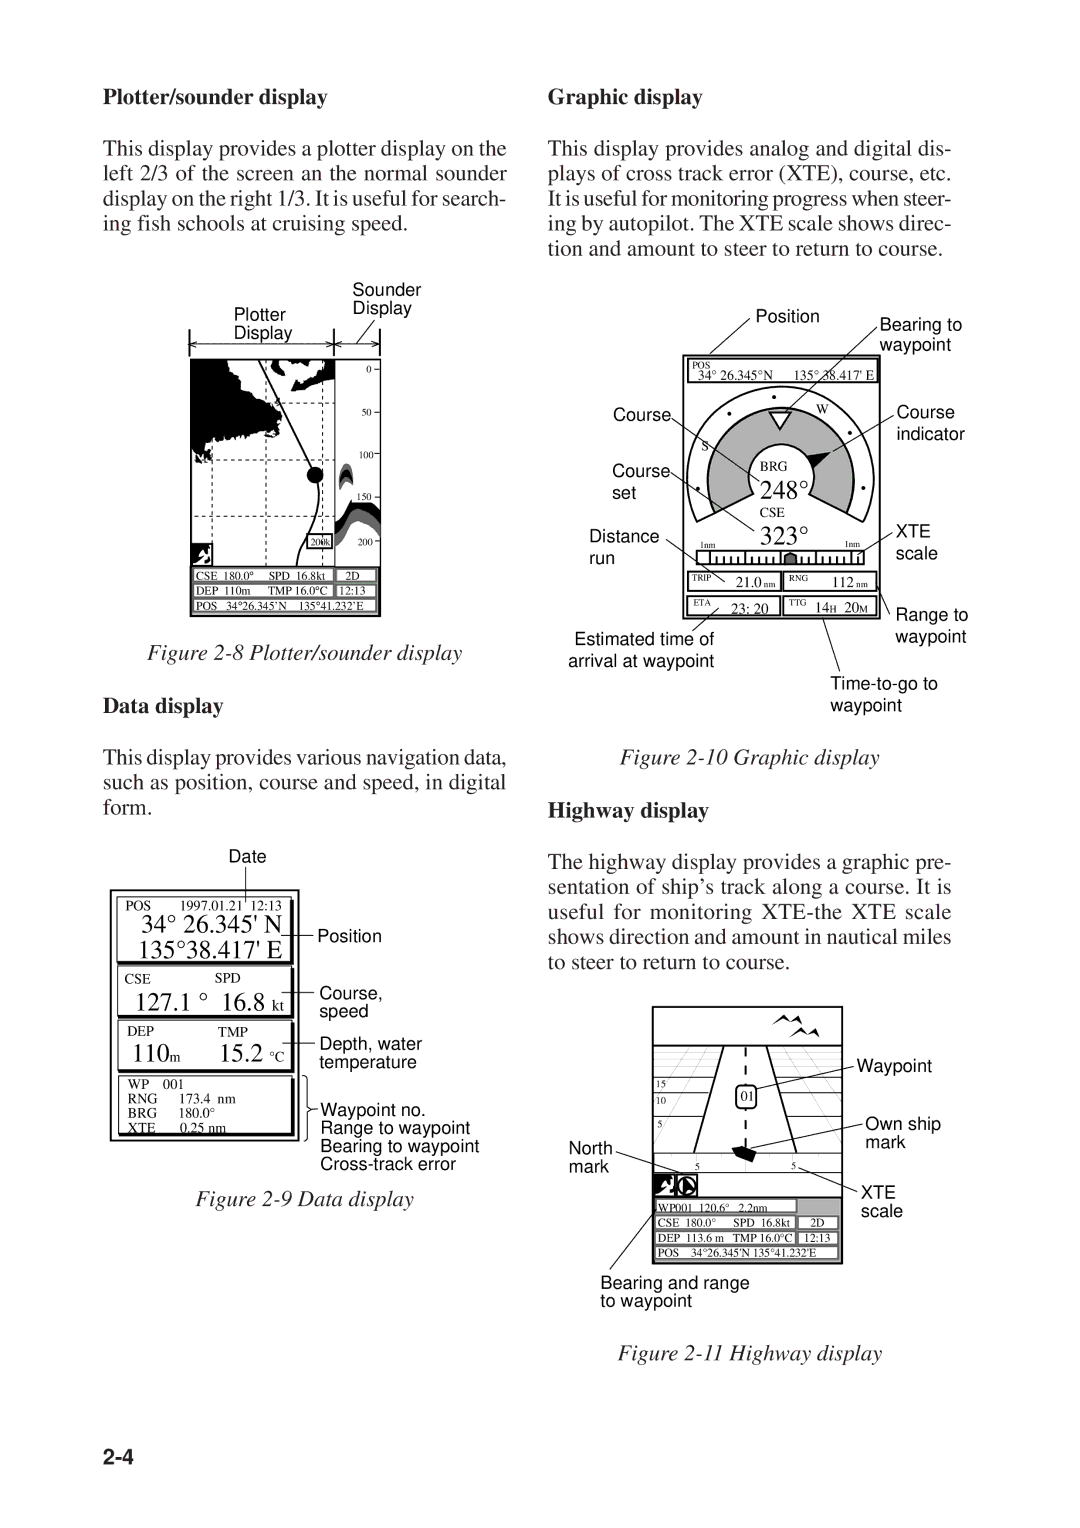
The Furuno GP-1610CF is a sophisticated marine navigation system designed for enthusiasts who demand accuracy and reliability on the water. Featuring a 10.4-inch color LCD display with a resolution of 640 x 480 pixels, this unit provides crystal-clear images of charts and navigation information, even under direct sunlight. Its user-friendly interface allows for intuitive management of various functions, making it accessible for both novice and experienced mariners.One of the standout features of the GP-1610CF is its integrated GPS receiver, which boasts a high sensitivity that ensures rapid acquisition of satellite signals and precise positioning. The unit supports a range of positioning formats, including WAAS (Wide Area Augmentation System), allowing for enhanced accuracy within the coastal dimensions. Additionally, the GP-1610CF is compatible with DGPS (Differential GPS) systems, further refining positional accuracy and providing a reliable navigation experience.
The GP-1610CF also supports C-MAP NT+ charting, offering an extensive variety of cartographic data covering numerous regions. This enables users to visualize marine environments with detailed bathymetric information, harbor layouts, and navigational aids. The system's customizable waypoints and route planner facilitate efficient marine navigation, allowing users to create multiple routes and track them in real time.
In terms of connectivity, the GP-1610CF offers NMEA 0183 output, which allows it to interface seamlessly with other marine electronics such as autopilots, radar systems, and depth sounders. This enabling communication between devices enhances overall situational awareness and improves navigation assistance.
The unit is built to withstand the harsh marine environment, featuring a robust housing that is resistant to saltwater, humidity, and temperature variations. Additionally, the GP-1610CF can function in challenging lighting conditions thanks to its adjustable contrast and brightness settings, which help maintain visibility during nighttime operation.
Overall, the Furuno GP-1610CF stands as a reliable choice for sailors seeking a high-performance navigation solution. With its combination of advanced GPS technology, high-resolution display, extensive chart compatibility, and robust design, this device continues to be a trusted companion for marine adventures around the globe. Whether cruising, fishing, or engaging in professional navigation, the GP-1610CF delivers essential features that empower users to navigate with confidence and accuracy.

