June Product Version
Hewlett-Packard Company Palo Alto, California
Page
Contents
Developing Applications
5.4
Tuning Applications
Using Slurm
Debugging Applications
Using LSF
Using HP-MPI
Using HP Mlib
6.4
Advanced Topics
Examples
Glossary Index Examples
Figures
Tables
Page
About This Document
Intended Audience
Document Organization
QuickSpecs for HP XC System Software
Linux Administration Handbook
HP XC Information
HP XC Program Development Environment
HP Message Passing Interface
For More Information
Supplementary Information
HP Mathematical Library
Http//systemimager.org
Manpages
Http//supermon.sourceforge.net
Http//sourceforge.net/projects/modules
Related Information
Http//linuxvirtualserver.org
Http//www-unix.mcs.anl.gov/mpi
# cd /opt/hptc/config/sbin
Typographical Conventions
Bold text
HP Encourages Your Comments
Ctrl/x
Page
Operating System
Overview of the User Environment
System Architecture
Node Specialization
SAN Storage
Storage and I/O
File System
Local Storage
System Interconnect Network
File System Layout
Network Address Translation NAT
Commands
User Environment
1 LVS
Application Development Environment
Parallel Applications
Serial Applications
Load Sharing Facility LSF-HPC
Run-Time Environment
Slurm
How LSF-HPC and Slurm Interact
Components, Tools, Compilers, Libraries, and Debuggers
HP-MPI
8Overview of the User Environment
LVS Login Routing
Using the System
Configuring Your Environment with Modulefiles
Using ssh to Log
2Using the System
Supplied Modulefiles
Supplied Modulefiles
Modulefile Sets the HP XC User Environment
Viewing Loaded Modulefiles
Modulefiles Automatically Loaded on the System
Viewing Available Modulefiles
Loading a Modulefile
Modulefile Conflicts
Automatically Loading a Modulefile at Login
Unloading a Modulefile
Loading a Modulefile for the Current Session
$ module load modules $ man modulefile
Creating a Modulefile
Viewing Modulefile-Specific Help
$ module help totalview
Getting Information About Queues
Launching and Managing Jobs Quick Start
Introduction
Getting Information About Resources
Submitting a Serial Job
Getting Information About the System’s Partitions
Launching Jobs
Example 2-1 Submitting a Serial Job
Example 2-2 Submitting a Non-MPI Parallel Job
Using Slurm Options with the LSF External Scheduler
Submitting a Non-MPI Parallel Job
$ bsub -n4 -I srun hostname
Submitting an MPI Job
Example 2-4 Running an MPI Job with LSF
$ bsub -n4 Mpirun -srun ./helloworld
Submitting a Batch Job or Job Script
Example 2-6 Submitting a Job Script
$ bsub -I -n4 myjobscript.sh
Performing Other Common User Tasks
Getting System Help and Information
$ man sinfo
$ man -k keyword
Page
Developing Applications
Overview
Intel Compilers
Using Compilers
Standard Linux Compilers
PGI Compilers
Interrupting a Job
Setting Debugging Options
Checking Nodes and Partitions Before Running Jobs
Developing Serial Applications
Serial Application Build Environment
Using Mlib in Serial Applications
Developing Parallel Applications
Building Serial Applications
HP-MPI
Parallel Application Build Environment
Modulefiles
OpenMP
MPI Library
Quadrics Shmem
Mlib Math Library
$ mpicc object1.o ... -pthread -o myapp.exe
GNU C and C++ Compilers
Intel Fortran and C/C++Compilers
PGI Fortran and C/C++ Compilers
GNU Parallel Make
Compiling and Linking Non-MPI Applications
Reserved Symbols and Names
Building Parallel Applications
Compiling and Linking HP-MPI Applications
Developing Libraries
Designing Libraries for XC4000
$ mpicc -c -g foo.c
Example 3-1 Directory Structure
Using the GNU Parallel Make Capability
Advanced Topics
Example 3-2 Recommended Directory Structure
$ cd subdir srun $MAKE
$ cd subdir srun -n1 -N1 $MAKE -j4
Example Procedure
$ make PREFIX=’srun -n1 -N1 MAKEJ=’-j4’
$ make PREFIX=’srun -n1 -N1’ MAKEJ=’-j4’
Shared File View
Local Disks on Compute Nodes
3 I/O Performance Considerations
Private File View
Communication Between Nodes
Page
Debugging Parallel Applications
Debugging Applications
Debugging Serial Applications
TotalView
Setting Up TotalView
Debugging with TotalView
SSH and TotalView
$ srun -Nx-A $ mpirun -tv -srun application
Using TotalView with Slurm
Using TotalView with LSF-HPC
$ bsub -nx-ext SLURMnodes=x \ -Is /usr/bin/xterm
Starting TotalView for the First Time
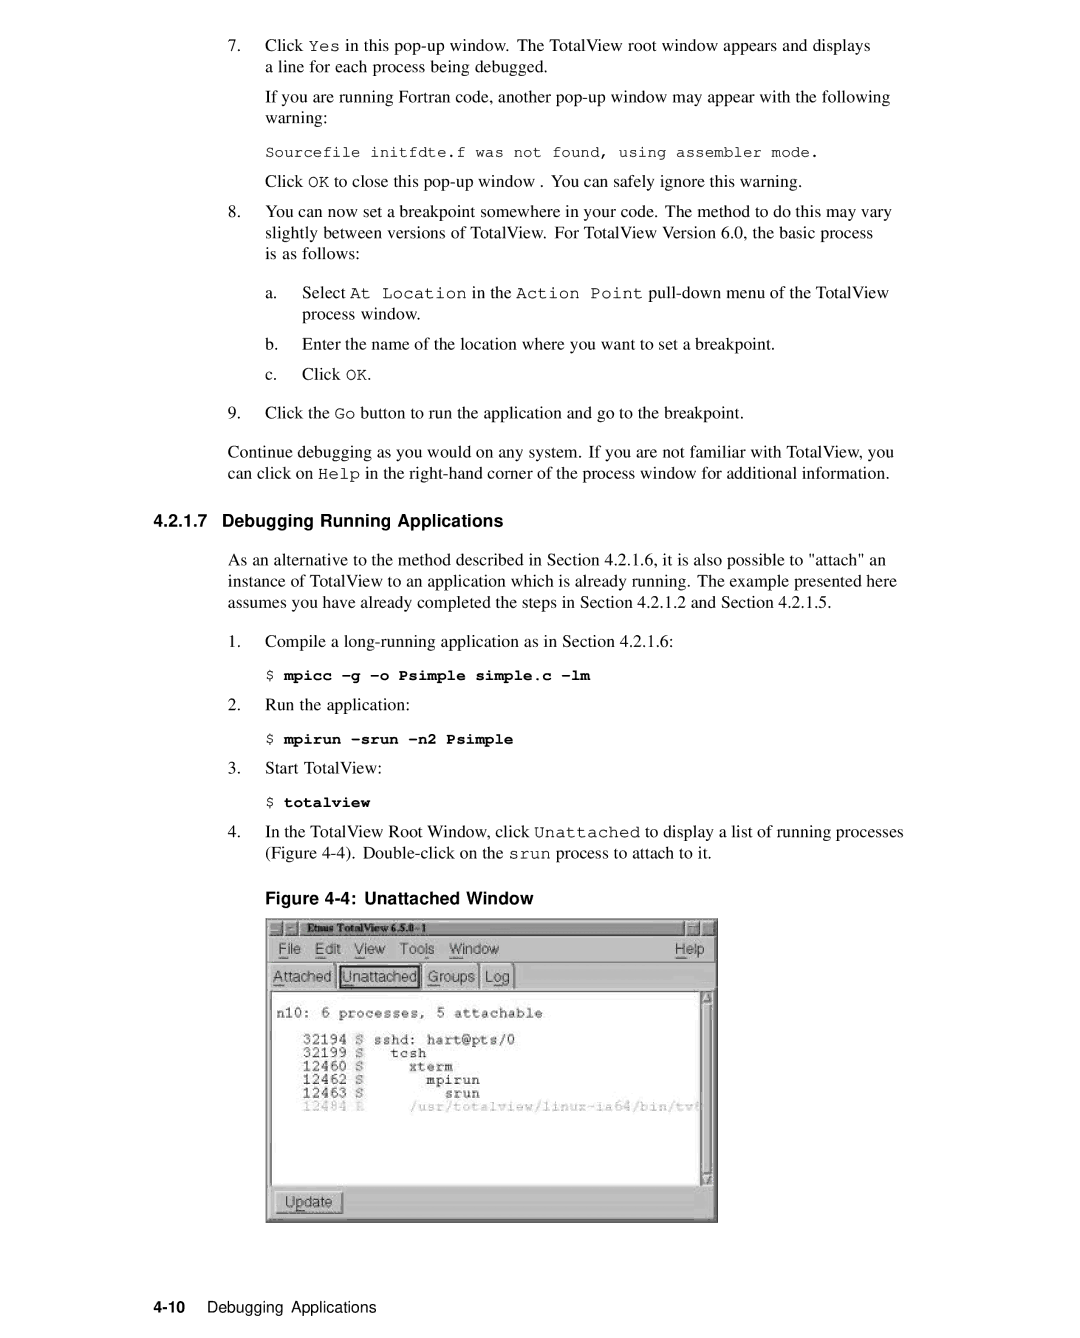
$ totalview
TotalView Preferences Window
Preferences window, click on the Launch Strings tab
Debugging Applications
Debugging an Application
$ mpicc -g -o Psimple simple.c -lm
$ mpirun -tv -srun -n2 ./Psimple
TotalView Process Window Example
Debugging Running Applications
$ mpirun -srun -n2 Psimple
$ scancel --user username
Exiting TotalView
$ squeue
Page
Building a Program Intel Trace Collector and HP-MPI
Tuning Applications
Using the Intel Trace Collector/Analyzer
Example
Running a Program Intel Trace Collector and HP-MPI
Visualizing Data Intel Trace Analyzer and HP-MPI
Example Running the vtjacobic Example Program
Command Function
Using Slurm
Slurm Commands
Introduction
Srun Roles and Modes
Accessing the Slurm Manpages
Launching Jobs with the srun Command
Example 6-1 Simple Launch of a Serial Program
Srun Roles
Srun Modes
Batch
Srun Signal Handling
Srun Run-Mode Options
Allocate
Srun Resource-Allocation Options
Minutes --time=minutes
Cpt --cpus-per-task=cpt
Part --partition=part
Nthreads --threads=nthreads
Srun Control Options
Srun I/O Options
Mode --error=mode
Mode --output=mode
Mode --input=mode
Label
Srun Constraint Options
Clist --constraint=clist
Mincpus=n
Contiguous=yesno
Mem=size
Vmem=size
Using srun with LSF
Monitoring Jobs with the squeue Command
Using srun with HP-MPI
Srun Environment Variables
Killing Jobs with the scancel Command
Getting System Information with the sinfo Command
Security
Fault Tolerance
Job Accounting
$ sinfo -R
Using LSF
Introduction to LSF in the HP XC Environment
Overview of LSF
Topology Support
Nodelist= list-of-nodes Exclude= list-of-nodes
$ bsub -n 10 -ext SLURMnodes=10 srun myapp
$ bsub -n 10 -ext SLURMnodes=10exclude=n16 srun myapp
How LSF and Slurm Launch and Manage a Job
$ bqueues -l normal grep Jobstarter
$ bsub -Is hostname
How LSF-HPC and Slurm Launch and Manage a Job
$ bsub -n4 -ext SLURMnodes=4 -o output.out ./myscript
Differences Between LSF on HP XC and Standard LSF
Getting Status of LSF
Determining Execution Host
Determining Available System Resources
Job Startup and Job Control
Getting Information About LSF-HPC Execution Host Node
Getting Host Load Information
Getting Information About the lsf Partition
Submitting Jobs
Checking LSF System Queues
$ sinfo -p lsf
Summary of the LSF bsub Command Format
Bsub bsuboptions jobname joboptions
LSF-SLURM External Scheduler
Slurm Arguments Function
Starting on lsfhost.localdomain n6
Submitting an HP-MPI Job
Submitting a Serial Job
Submitting a Job in Parallel
Example 7-5 Submitting an Interactive Serial Job
Submitting a Batch Job or Job Script
Example 7-6 Submitting an HP-MPI Job
$ bsub -n4 -I mpirun -srun ./helloworld
$ bsub -n4 -I ./myscript.sh
Examples
Example 7-8 Submitting a Batch Job Script
$ bsub -n4 -ext SLURMnodes=4 -I ./myscript.sh
Submitting a Job from a Non-HP XC Host
$ bsub -n4 -I ./myscript.sh -n8 -O
Type=SLINUX64
Job Allocation Information for a Running Job
Getting Information About Jobs
Getting Job Allocation Information
$ bsub -R type=SLINUX64 -n4 -I srun hostname
Example 7-13 Using the bjobs Command Short Output
Checking Status of a Job
Job Allocation Information for a Finished Job
Output Provided by the bhist Command
Example 7-14 Using the bjobs Command Long Output
Example 7-15 Using the bhist Command Short Output
Viewing a Job’s Historical Information
Example 7-16 Using the bhist Command Long Output
Working Interactively Within an LSF-HPC Allocation
Submitting an Interactive Job to Launch the xterm Program
Example 7-19 View Your Running Job in LSF
Example 7-17 View Your Environment
Example 7-18 View Your Allocation in Slurm
Example 7-20 View Job Details in LSF
Example 7-22 Submitting an Interactive Shell Program
Submitting an Interactive Job to Launch a Shell
Example 7-21 Running Jobs from an xterm Window
$ hostname $ srun hostname $ srun -n2 hostname
$ srun hostname n1 $ exit
LSF Equivalents of Slurm srun Options
LSF Equivalents of Slurm srun Options
Srun Option Description LSF Equivalent
24Using LSF
Control the parallel job
Page
Using HP-MPI
Compiling and Running Applications
Setting Environment Variables
HP-MPI Directory Structure
Building and Running an Example Application
$ mpicc -o helloworld $MPIROOT/help/helloworld.c
Example Application helloworld
Building and Running helloworld
$ $MPIROOT/bin/mpirun -srun -n4 helloworld
Launching MPI Jobs
HP-MPI options allowed with -srun
$ mpirun -srun -n6 -O -N2 -m cyclic ./a.out host1 rank1
Creating Subshells and Launching Jobsteps
System Interconnect Selection
$ mpirun -srun -n4 -N2 -O -m cyclic ./a.out host1 rank1
Using LSF and HP-MPI
$ mpirun -subnet 192.168.1.1 -prot -srun -n4 ./a.out
MPI Versioning
$ /usr/sbin/ifconfig -a
System Interconnect Support
Example 8-5 Allocating 12 Processors on 6 Nodes
32-Bit Builds on XC4000
Truncated Messages
Allowing Windows to Use Exclusive Locks
Mpirun Command Options
$ mpirun -TCP -srun -N8 ./a.out
Environment Variables
$MPIROOT/bin/mpirun -v -prot -np 2 /path/to/program.x
Export MPIPAGEALIGNMEM=1
Export MPIPHYSICALMEMORY=1048576
Export MPIPINPERCENTAGE=30
Export MPIMAXWINDOW=10
Export MPIUSELIBELANUSE=5
Mpich Object Compatibility
Export MPIUSELIBELAN=0
$MPIROOT/bin/mpirun.mpich -np 2 ./prog.x
HP-MPI Manpage Categories
HP-MPI Documentation and Manpages
At http//docs.hp.com
Category Manpages Description
Additional Information, Known Problems, and Work-arounds
Version 8 Fortran Compiler
Using HP Mlib
Intel Compiler Notes
Version 7 Fortran Compiler
Platform Support
HP Mlib for the HP XC6000 Platform
Mlib and Module Files
Library Support
Using Intel Compilers with HP Mlib
Modulefiles and Mlib
Compiling and Linking
Mlib Manpages
HP Mlib for the HP XC4000 Platform
Licensing
Linking SuperLUDIST
$ pgcc options file
6Using HP Mlib
Running an X Terminal Session from a Remote Node
Advanced Topics
Enabling Remote Execution with OpenSSH
Determining IP Address of Your Local Machine
$ hostname
Running an X terminal Session Using Slurm
Logging in to HP XC System
$ host mymachine
Running an X terminal Session Using LSF
$ bsub -n4 -Ip srun -n1 xterm -display
$ bjobs
Page
Examples
Building and Running a Serial Application
Launching a Serial Interactive Shell Through LSF
Running LSF Jobs with a Slurm Allocation Request
Example 1. Two Processors on Any Two Nodes
Launching a Parallel Interactive Shell Through LSF
Example 2. Four Processors on Two Specific Nodes
View the job
Check the running job’s information
$ bsub -Is -n4 -ext SLURMnodes=4 /bin/bash
Show the environment
Submitting a Simple Job Script with LSF
Check the finished job’s information
Display the script
Show the Slurm job ID
Submitting an Interactive Job with LSF
Show the job allocation
$ bsub -n8 -Ip /bin/sh
Submitting an HP-MPI Job with LSF
View the running job
View the finished job
$ bjobs -l
Using a Resource Requirements String in an LSF Command
$ bsub -n 8 -R ALPHA5 SLINUX64 \ -ext SLURMnodes=4-4 myjob
Page
Glossary
Fairshare
Extensible firmware interface
External network node
First come first served
Interconnect
Image server
Integrated Lights Out
Internet address
Management Processor
Network Information Services
LSF master host
Master host
Resource manager role
Root Administration Switch
Parallel application
Role
Symmetric multiprocessing
Glossary-6
Index
Index-1
Gdb, 4-1 GNU
Index-2
Modulefile
Index-3
Resource manager, 7-1role Serial applications
Index-4