where level, R, G, and B are integers between 0 and 255, inclusive. The level column represents the signal level, and R, G, and B are the usual RGB colour components.
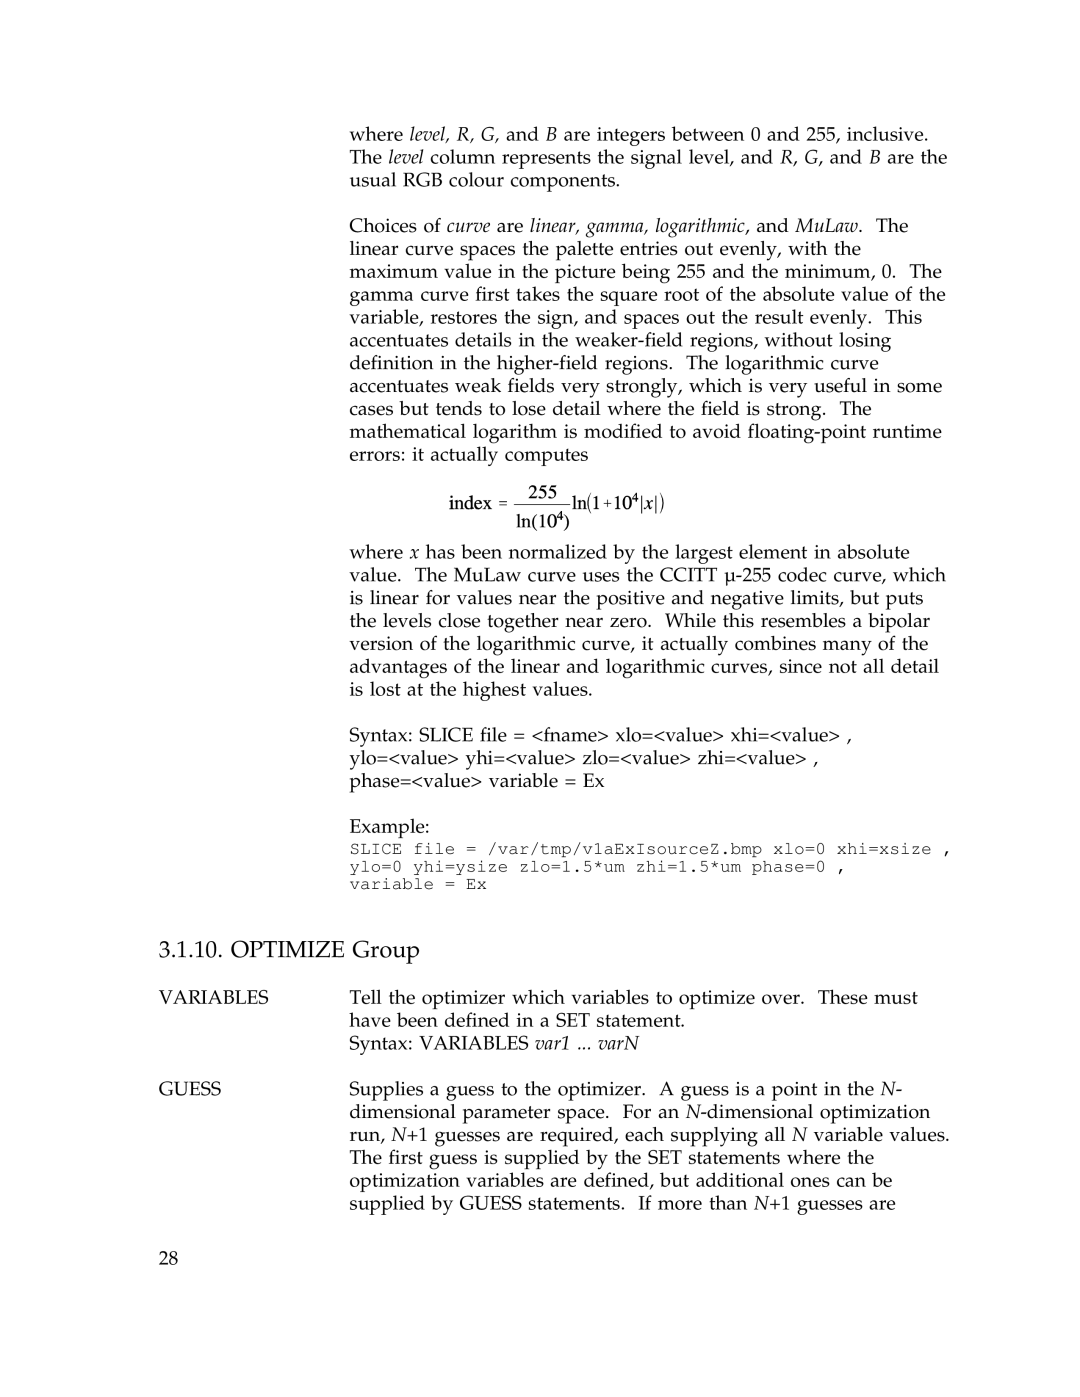
Choices of curve are linear, gamma, logarithmic, and MuLaw. The linear curve spaces the palette entries out evenly, with the maximum value in the picture being 255 and the minimum, 0. The gamma curve first takes the square root of the absolute value of the variable, restores the sign, and spaces out the result evenly. This accentuates details in the
where x has been normalized by the largest element in absolute value. The MuLaw curve uses the CCITT
Syntax: SLICE file = <fname> xlo=<value> xhi=<value> , ylo=<value> yhi=<value> zlo=<value> zhi=<value> , phase=<value> variable = Ex
Example:
SLICE file = /var/tmp/v1aExIsourceZ.bmp xlo=0 xhi=xsize , ylo=0 yhi=ysize zlo=1.5*um zhi=1.5*um phase=0 , variable = Ex
3.1.10. OPTIMIZE Group
VARIABLES | Tell the optimizer which variables to optimize over. These must |
| have been defined in a SET statement. |
| Syntax: VARIABLES var1 ... varN |
GUESS | Supplies a guess to the optimizer. A guess is a point in the N- |
| dimensional parameter space. For an |
| run, N+1 guesses are required, each supplying all N variable values. |
| The first guess is supplied by the SET statements where the |
| optimization variables are defined, but additional ones can be |
| supplied by GUESS statements. If more than N+1 guesses are |
28
