USING THE TONE CURVE
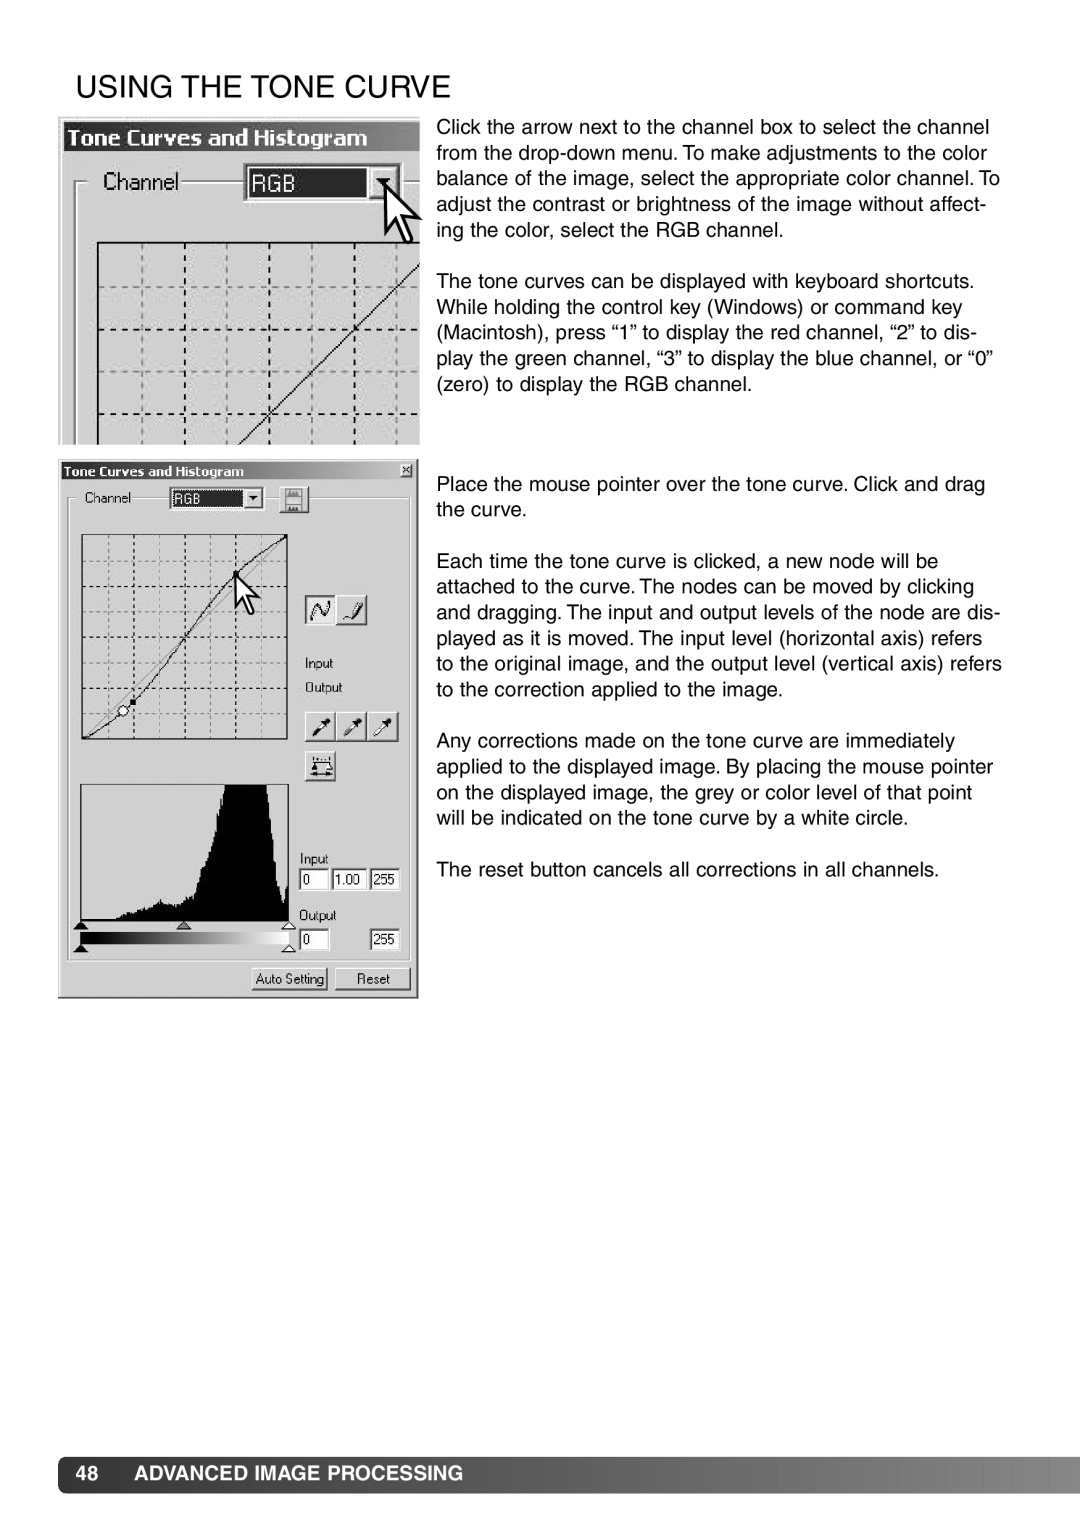
Click the arrow next to the channel box to select the channel from the
The tone curves can be displayed with keyboard shortcuts. While holding the control key (Windows) or command key (Macintosh), press “1” to display the red channel, “2” to dis- play the green channel, “3” to display the blue channel, or “0” (zero) to display the RGB channel.
Place the mouse pointer over the tone curve. Click and drag the curve.
Each time the tone curve is clicked, a new node will be attached to the curve. The nodes can be moved by clicking and dragging. The input and output levels of the node are dis- played as it is moved. The input level (horizontal axis) refers to the original image, and the output level (vertical axis) refers to the correction applied to the image.
Any corrections made on the tone curve are immediately applied to the displayed image. By placing the mouse pointer on the displayed image, the grey or color level of that point will be indicated on the tone curve by a white circle.
The reset button cancels all corrections in all channels.
![]() 48
48![]()
![]() ADVANCED IMAGE PROCESSING
ADVANCED IMAGE PROCESSING![]()
![]()
![]()
![]()
![]()
![]()
![]()
![]()
![]()
![]()
![]()
![]()
![]()
![]()
![]()
![]()
![]()
![]()
![]()
![]()
![]()
![]()
![]()
![]()
![]()
