DGN100Bv3 specifications
The NETGEAR DGN100Bv3 is a versatile and feature-rich ADSL2+ modem router that is designed to cater to the needs of home users and small offices. By combining a high-performance modem and router in one compact device, it significantly simplifies the network setup, reducing the need for multiple devices and management points.One of the standout features of the DGN100Bv3 is its ADSL2+ compatibility, allowing users to connect to various DSL internet service providers efficiently. This modem/router supports downstream rates of up to 24 Mbps and upstream rates of up to 1 Mbps, providing a robust solution for everyday browsing, streaming, and online gaming.
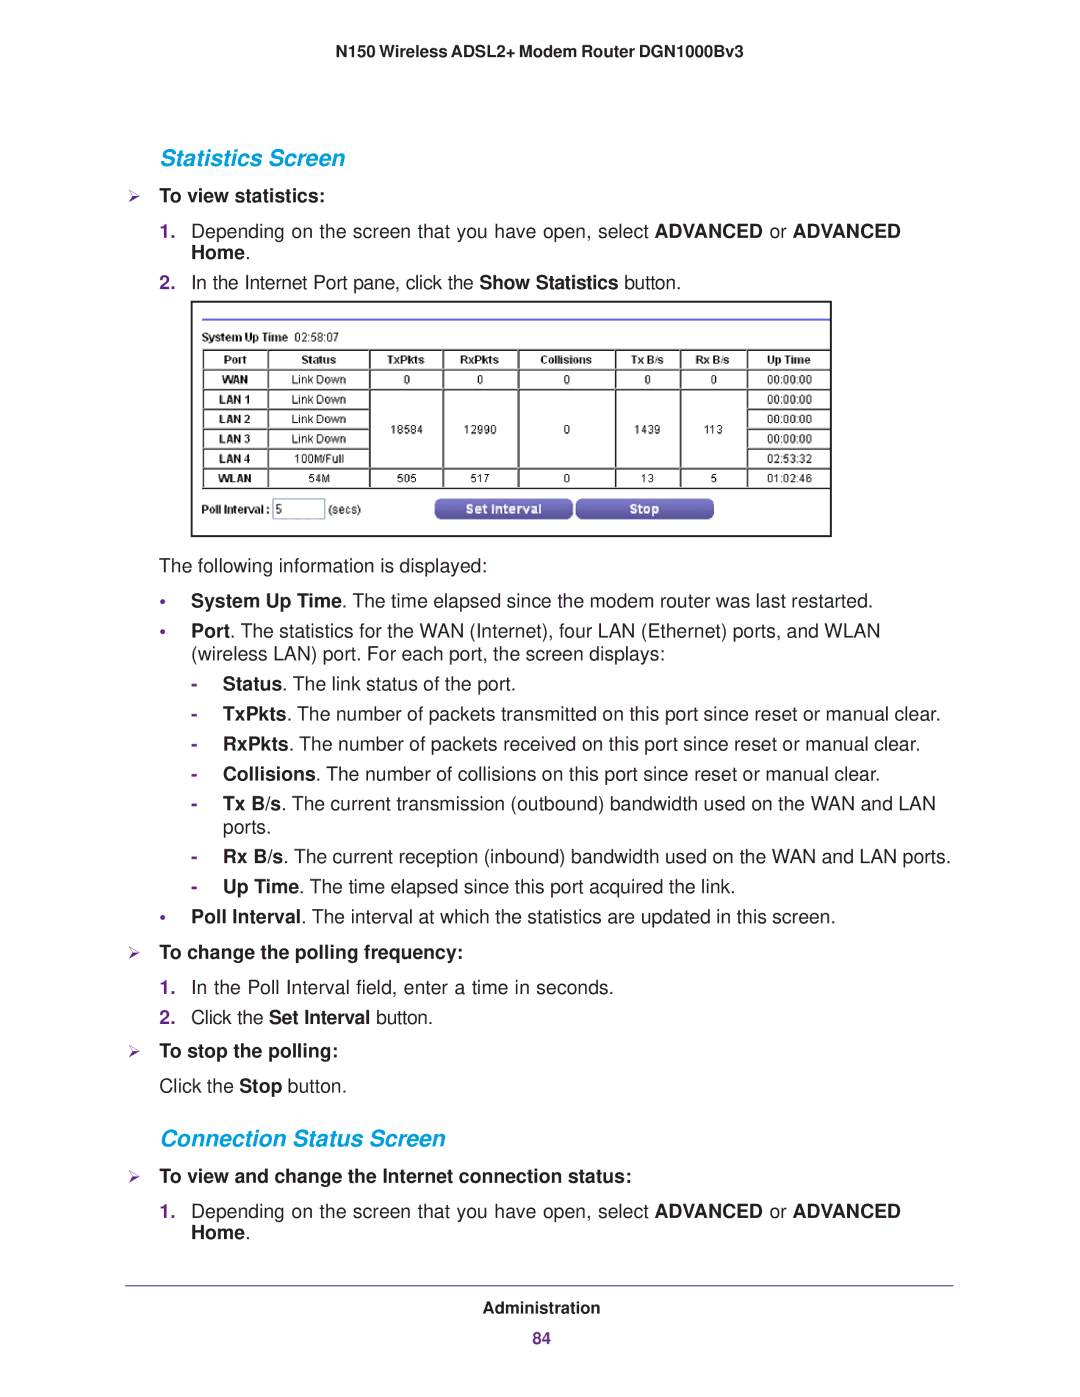
Equipped with 4 10/100 Ethernet ports, the DGN100Bv3 allows multiple devices to connect via wired connections, providing reliable and fast speeds for activities that demand stable internet access. Additionally, it features integrated wireless 802.11n technology, which enables users to create a secure Wi-Fi network with wireless speeds of up to 300 Mbps. This makes it ideal for multiple users who are streaming videos, engaging in video calls, or downloading large files simultaneously.
Security is also a key focus in the DGN100Bv3 design, offering comprehensive security features such as a robust firewall, WPA/WPA2 wireless security protocols, and support for Network Address Translation (NAT). This ensures that the network remains secure against external threats, giving users peace of mind.
Configuration and management of the DGN100Bv3 are straightforward, thanks to an intuitive web interface accessible via a browser. Users can easily set up parental controls, traffic prioritization, and network settings to optimize their experience. Additionally, the device supports Quality of Service (QoS), which helps manage bandwidth allocation for different applications, ensuring that critical services receive the necessary resources for optimal performance.
In summary, the NETGEAR DGN100Bv3 is a robust and efficient modem router that combines high-speed connectivity with ease of use, security, and management features. Its combination of ADSL2+ capabilities and wireless technology makes it a great choice for home users seeking reliable internet access and effective network management. Whether for casual browsing or demanding online activities, the DGN100Bv3 delivers a reliable and powerful solution suitable for diverse networking needs.

