User’s Manual
Trademark Information
Package Contents
Table of Contents
138
116
Color Management Tab 138
Appendix a Supported Color Profiles 140
Before You Begin
Principal Features
Overview
System Requirements
Overview
Symbols and Conventions
Background Knowledge
Illustrations
Features Available in Nikon Capture
Principal Features
Nikon Capture 4 Editor
Nikon Capture 4 Camera Control
Automatic Update
What You Need to Run Nikon Capture
Installation
System Requirements
Page
Nikon Capture 4 Editor Preferences
Image Adjustment
Editor Window
Getting to Know Nikon Capture 4 Editor
Editor Window
Name Function Shortcut
Quick Tools
Other Ways of Starting the Editor Windows
Starting Nikon Capture 4 Editor
Windows
Other Ways of Starting the Editor Mac OS
Macintosh
Product Key
Exiting Nikon Capture 4 Editor
Original image/saved image Format
Using the Open... Command
Opening Image Files
Using Drag and Drop
Opening the Multi-Image Window
Button Name Function
When the thumbnail area is closed
Multi-Image Window Buttons
Multi-Image Menu
When the thumbnail area is open
Button
To zoom images in and out, click the but
Zoom
Scrolling the Image
Double-Clicking the and Buttons
Bird’s Eye Palette
Rotating Images
Rotating and Flipping Images
Flipping Images
Rotate 90 CCW button Rotate 90 CW button
Rotation Text Box
Straightening Images
Draw Level Button
Selecting a Crop
Cancelling the Current Crop
Moving the Crop
Changing the Size of the Crop
Monitoring Watch Points
Information Palette
Selecting Watch Points
Information Description
RGB and Average Values Preferences Advanced Color
Moving a Watch Point
Deleting a Watch Point
Show Lost Highlights
Lost Highlights and Shadows
Show Lost Shadows
Lost Highlights and Shadows
Input Start/End
Histogram Palette
Markers
To display or hide the Mark- 29. By default, the Markers
Markers Palette
Color Aberration Control
Show Focus Area
Show Focus Area
Lateral Chromatic Aberration
Using the Tool Palettes
Image Adjustment
Displaying the Contents of a Tool Palette
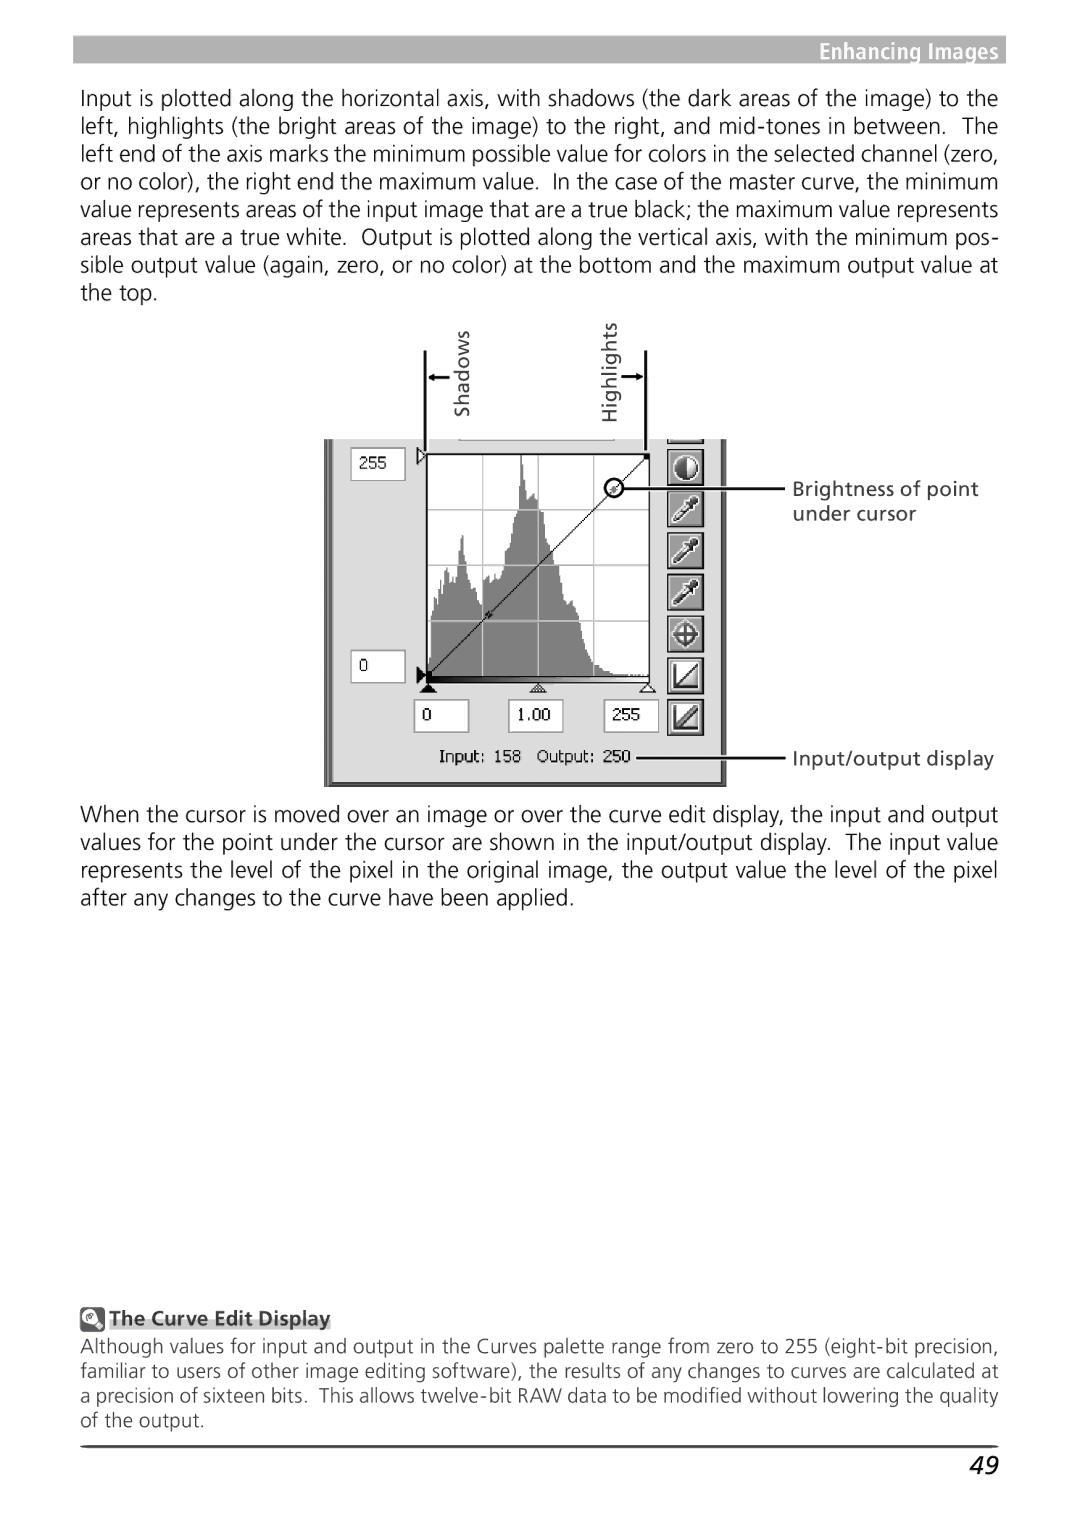
Enhancing Images
Resetting the Tool Palettes
Edit Indicator
Finding Tools
Undo and Redo
Curves Tool and the LCH Editor
Process Palette
Tiff and Jpeg Images
Suggested steps for processing images are shown below
RAW Images
White Balance
Specifying a Color Temperature
Select Set Color Temperature
Coolpix Cameras
Sub-menu Color
Reset button
Using a Single Point to Define White Balance
Sampling the Image for Gray Point Select Set Gray Point
Sample Size
Gain
Choosing a Value for Gain
D2-series/D200
Write to Camera
Write to Card
Reading White Balance from the Memory Card
Option Description
White Balance Settings Menu
Settings Menu
Advanced RAW
Advanced RAW
Sharpening, Tone Comp., Color Mode, and Saturation
Color Mode
Exposure Compensation
Advanced RAW Settings Menu
Click Change
Image Dust Off
Image Dust Off
Cameras That Support Image Dust-Off
No Suitable Images Found
Images Taken with Other Cameras
Excessive Dust
Camera Shake
Creating Dust Off Ref Photos
Creating Dust Off Ref Photos D1-Series and D100 Cameras
Copy current Image Dust Off settings to the clipboard
Image Dust Off Settings Menu
Reusing Image Dust Off Settings
Off palette
Camera Type G or D lens Other lens
Vignette Control
Copy current Vignette Control settings to the clipboard
Vignette Control Settings Menu
To the saved settings
Restores default settings. Intensity will be set to
Opening NEF Files Saved in Nikon Capture 3.5x or Earlier
Curves
Curves-an Overview
Curve Edit Display
Channel Selection
Viewing the Histogram
Histogram button
Histogram RAW/16-Bit Tiff Images Only
White-Point and Black-Point Input Levels
Setting the White Point and Black Point
Image Adjustment
Sampling White Point or Black Point for the Current Channel
White Point and Black Point Output Levels
Midpoint Slider
Setting the Midpoint
Sampling the Image for Midpoint
Gamma
Resetting All Curves to Linear
Resetting the Active Curve to Linear
Editing Curves Directly
Adding New Points to the Curve
Curves Settings Menu
LCH Editor
Show Histogram button
Master Lightness Channel
Color Lightness Channel
Exclude Gray checkbox
Chroma editor is useful tool for adjusting color saturation
Chroma Channel
Scale button
Hue Channel
Settings
LCH Editor Settings Menu
Copy current LCH Editor settings to the clipboard
Copy current Color Booster settings to the clipboard
Color Booster Settings Menu
Revert to the saved settings
Reset Color Booster settings to default values
Enhance Dark Tones Auto button
Photo Effects
Effect menu
Reset Photo Effects settings to default values
Photo Effects Settings Menu
Copy current Photo Effects settings to the clipboard
Adjusting Overall Brightness
Adjusting Brightness, Contrast, and Color Balance
Adjusting Image Contrast
Adjusting Color Balance
Nikon Capture 3.5 or Earlier
Color Balance Settings Menu
Displaying the Color Balance Palette
Creating Unsharp Masks
Unsharp Mask
Unsharp Mask
Will instantly revert to the saved settings
Unsharp Mask Settings Menu
Copy current Unsharp Mask settings to the clipboard
Reducing Noise
Noise Reduction
Resets Noise Reduction settings to their default values
Noise Reduction Settings Menu
Copy current Noise Reduction settings to the clipboard
Lighting
Highlight Adjustment Drag the slider
Faster HS
Better Quality HQ
Copy current D-Lighting settings to the clipboard
D-Lighting Settings Menu
Reset D-Lighting settings to default values
Digital DEE
Confirmation Dialogs
Red eye Correction
Apply auto red-eye correction to other images
Red Eye Correction Settings Menu
Reset red-eye correction settings to default values
Fill color menu
Include areas where there is no image data check box
Reset Fisheye Lens settings to default values
Fisheye Lens Settings Menu
Copy current Fisheye Lens settings to the clipboard
Adjusting Size and Resolution
Output Size and Resolution
If you intend to use the image on a web page…
RAW Image Size D1X Only
Scale/File Size
Copy current Size/Resolution settings to the clipboard
Size/Resolution Settings Menu
Default value of 300 ppi 118.11 ppcm
Nsr
Paste from the Edit menu when the window is active
Saving and Loading Image Adjustment Settings
Cording to the settings in the file 92
Combination settings files are saved with the extension .set
Choosing a File Type
Saving Images
Nikon Electronic Format NEF
File type Compression
Options for Saving Image Files
Using the Save Command
Using the Save as… Command
File Naming Conventions
Error Messages
Save Options
Show only errors and warnings Progress Log tab
Close when done
Show file paths
Saves
Printing Images
Rent printer and paper size settings
Printer Displays the currently selected printer
Displays the current paper size
Print Setup…
Shutter speed, aperture, and white balance
Orientation
Option
Use Output Resolution
Setting up Your Printer Printing with Color Management
Choose from Inkjet printer or All other types
Normal Print Outputs the selected im- ages to a printer
Before Using Batch Processing
Click Batch Complete when processing is
Batch Processing
Open the Batch progress dialog
Selecting Folders for Batch Processing
Orientation
Existing Image Adjustment Settings
Size/Resolution
Minimize Button Windows
Log Area
Nikon Capture 4 Editor Preferences
Fine-Tuning Nikon Capture 4 Editor
Preferences dialog contains the following 6 tabs
Tab Description
General Tab
Maintain zoom when scale changes
By default, a D1X RAW file will be
File format for Save As
Opening Files with Photoshop Mac OS
Performance Tab
Enable Color Aberration Control
100
Save large previews for NEF files
101
Temporary Files Tab
Temporary Files tab offers the following option
Folder for temporary data
102
Advanced Color Tab
103
Grid Lines Tab
Color
Display grid line every
104
Color Management Tab Windows
Color Management Tab Macintosh
ColorSync Default Profiles for Documents
105
Macintosh version displays the following options
Multiple Displays Macintosh
106
Device Profiles
Capturing Photographs
107
Camera Control Window
Nikon Capture 4 Camera Control Preferences
Getting to Know Nikon Capture 4 Camera Control
Camera Control Window
108
Choose PTP
109
Operating system D100
110
Starting Nikon Capture 4 Camera Control
Connect the camera
Other Ways of Starting Camera Control
Camera Control window will be displayed
Exiting Nikon Capture 4 Camera Control
111
112
Adjust capture options 113
Capturing Photographs to Disk
Nikon View
Adjust capture options
113
Auto Image Rotation D2-Series/D200/D70s/D70/D50 Only
114
Minimize Button
115
116
Processing Photographs as They Are Captured
Select Live Batch from the Camera menu
Open the Live Batch dialog Open the batch progress dialog
Live Batch Processing
117
118
Apply Settings Written by Camera Versus Save Unmodified Files
119
120
Time Lapse Photography
121
Manual exposure mode
AE/WB/Flash Bracketing Choose
Type of bracketing performed
122
Hard Disk Full Error Logs
During Time-Lapse Photography
Auto Off D1-Series Cameras
123
Nikon Capture 4 Camera Control Window
Connection Status
Hide Camera Control
124
Camera Settings That Can Not Be Adjusted from Nikon Capture
Simulated LCD Panel
Shoot Buttons
125
Following settings can be adjusted from the Exposure 1 tab
Exposure 1 Tab
Non-CPU Lenses
Exposure 2 Tab
Connected, or if Enable controls on
126
Storage Tab
127
128
Following settings can be adjusted from the Mechanical tab
Mechanical Tab
Speed or Continuous high speed is select
129
D2 series/D200
130
D100 D70s/D70/D50
Camera body is
Image Processing Tab
131
132
Custom Settings…
Camera Menu
Set Date and Time…
Set Color Temperature… D2 Series/D200 Only
Choosing a Mode D70s/D70/D50 Only
133
Pop-up menu at the top of the dialog
Edit Image Comment…
134
Live Batch…
Selecting this option opens the Live Batch dialog
Select Custom Settings… from the Camera menu
Custom Settings
Changes to Custom Settings
Custom Settings
Custom Settings for D2-Series and D200 Cameras
Custom Settings for D70, D70s, and D50 Cameras
136
1, Page 2, and Page 3. See the camera manual for details
Nikon Capture 4 Camera Control Preferences
Fine-Tuning Nikon Capture 4 Camera Control
137
Preferences dialog contains the following three tabs
138
Color Management Tab
Temporary Files tab contains the fol- lowing item
Folder for Temporary Data
139
Standard RGB Profiles Supported in Nikon Capture
Appendix a
140
Supported Color Profiles
CIE RGB NKCIE.icm Windows/Nikon CIE RGB 4.0.0.3000 Macintosh
141
Nikon Capture 4 and Adobe Photoshop Color Profiles
Technical Data for RGB Profiles Supported in Nikon Capture
142
143
Appendix B
Choosing a Monitor Profile
144
Adjusting Settings in Adobe Photoshop
Opening Tiff and Jpeg Images Created Using Nikon Capture
Nikon NEF Plug-in
Appendix C
145
Opening Modified Images
146
Nikon NEF Plug-in
Windows Nikon NEF Plugin.8Bi
Appendix D
Troubleshooting
147
Nikon Capture 4 Does Not Start
Appendix D
148
149
Appendix E
Glossary
See Color management system
Compression
150
ICC
151
RGB
152
Threshold
153
White balance
154
155
Index
JPEG, 13, 20, 83 LCD
57-62
156