Measuring Your Blood Pressure (cont.)
Trend Graph Function
This blood pressure monitor can display previous measurement results in a graph to allow you to see the trend in your blood pressure. Measurements taken in the morning are displayed as a graph in stored morning data; measurements taken in the evening as a graph in stored evening data; and measurements taken at other times as a graph in stored data for all time periods.
(Measurements taken in the morning are measurements taken between 3:00 AM and 11:00 AM, and measurements taken in the evening are measurements taken between 6:00 PM and 2:59 AM.)
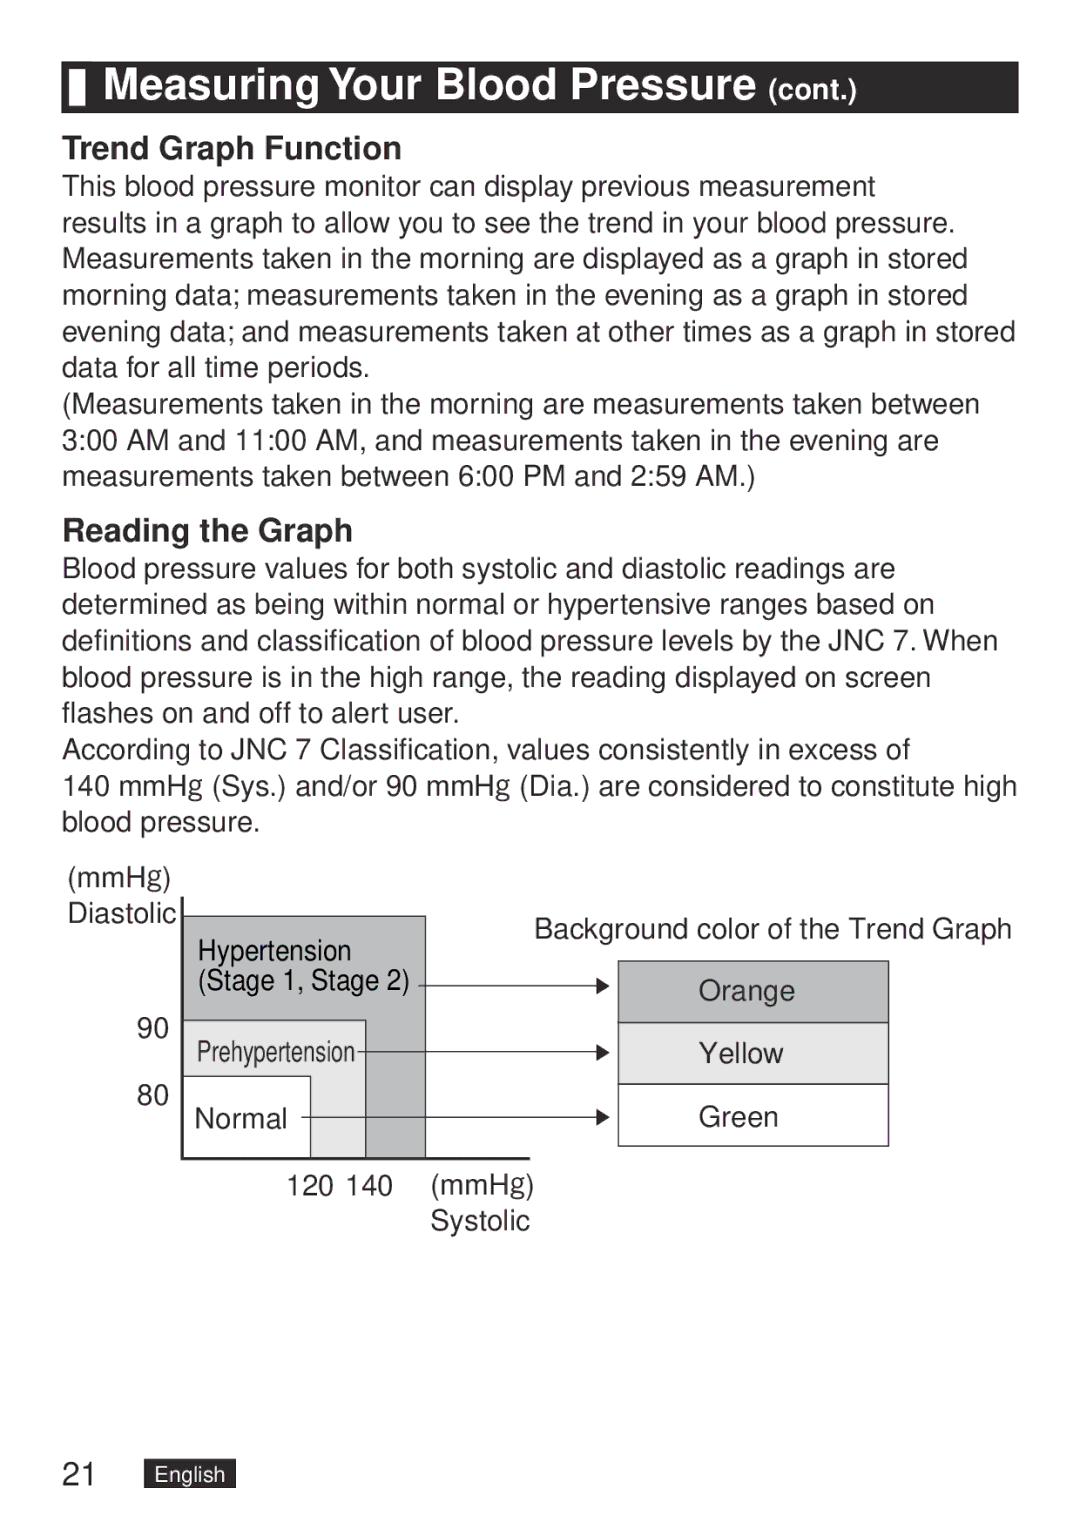
Reading the Graph
Blood pressure values for both systolic and diastolic readings are determined as being within normal or hypertensive ranges based on definitions and classification of blood pressure levels by the JNC 7. When blood pressure is in the high range, the reading displayed on screen flashes on and off to alert user.
According to JNC 7 Classification, values consistently in excess of
140 mmHg (Sys.) and/or 90 mmHg (Dia.) are considered to constitute high blood pressure.
(mmHg) Diastolic
90
80
|
|
|
|
| Background color of the Trend Graph | |||||
Hypertension | ||||||||||
|
|
|
|
|
| |||||
(Stage 1, Stage 2) |
|
|
|
| Orange |
| ||||
|
|
|
|
| ||||||
|
|
|
|
|
|
|
|
| ||
|
|
|
|
|
|
|
|
|
| |
Prehypertension |
|
|
|
|
| Yellow |
| |||
|
|
| ||||||||
|
|
|
|
|
|
|
|
|
| |
Normal |
|
|
|
|
|
|
| Green |
| |
|
|
|
|
|
| |||||
|
|
|
|
|
|
|
|
|
| |
|
|
|
|
|
|
|
|
|
| |
120 140 | (mmHg) | |||||||||
|
|
|
| Systolic | ||||||