3520C specifications
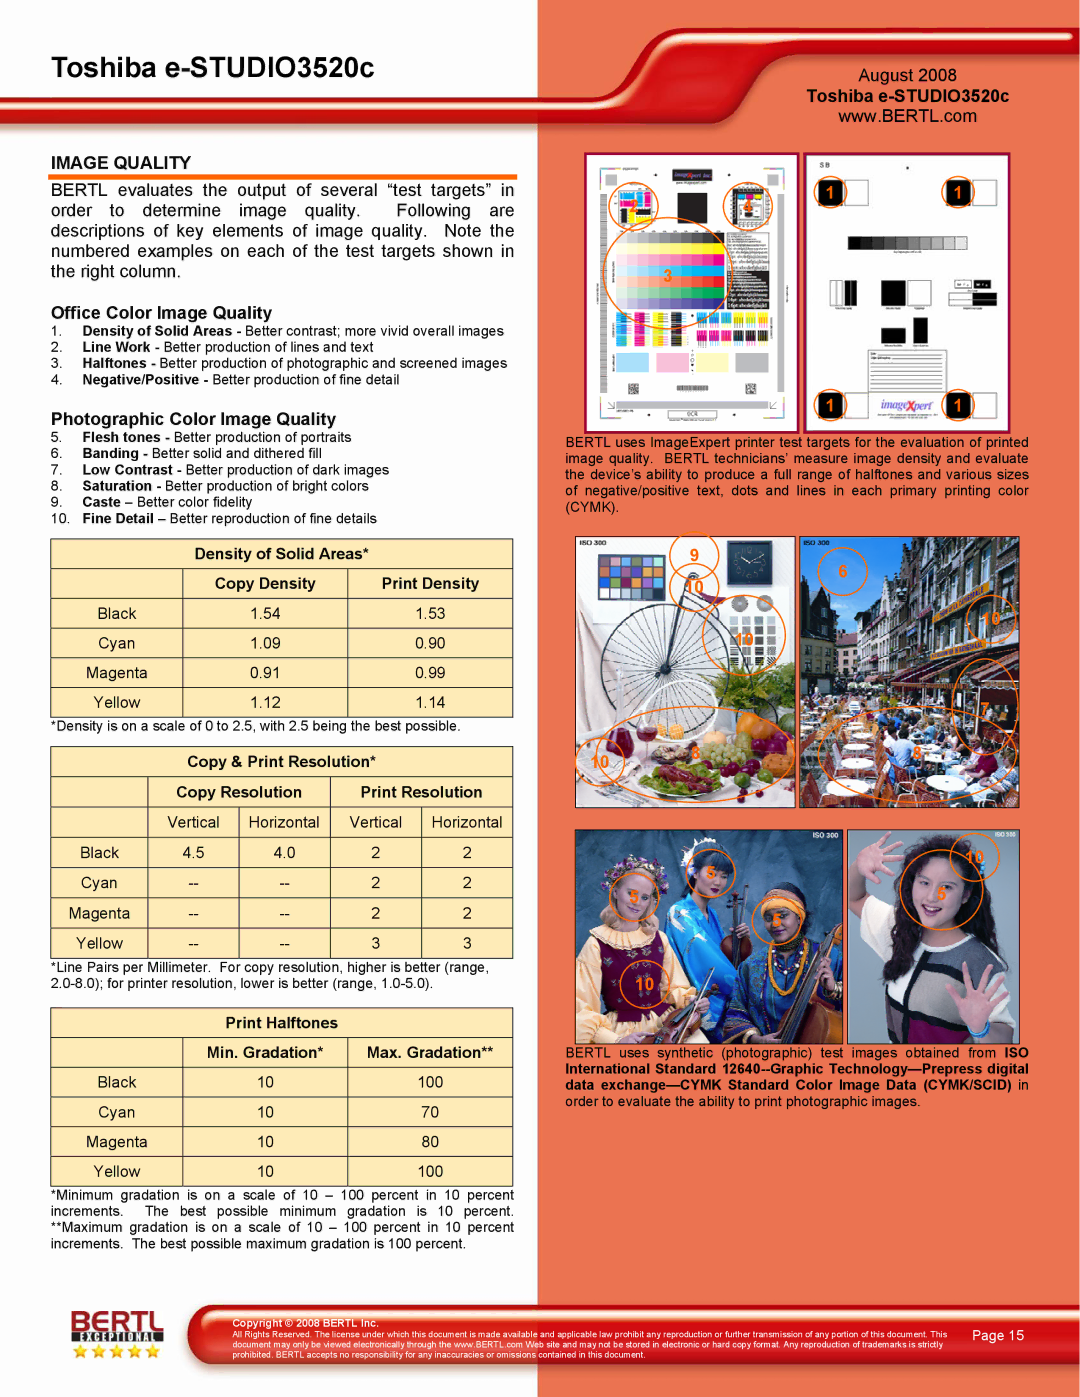
The Toshiba 3520C is a versatile color multifunction printer that caters perfectly to the needs of small to medium businesses. Known for its efficient performance and robust feature set, this model stands out in a competitive market.One of the key features of the Toshiba 3520C is its ability to print, copy, scan, and fax, all in one compact unit. This multifunctionality not only saves valuable office space but also streamlines workflow, allowing users to perform multiple tasks without the need for separate devices. The printer boasts a high-quality color output, with a printing resolution of up to 1200 x 1200 dpi, ensuring that documents and images appear sharp and vibrant.
In terms of speed, the Toshiba 3520C does not disappoint. It can print up to 35 pages per minute in monochrome and 33 pages per minute in color, making it suitable for busy office environments where efficiency is a priority. Additionally, the first print time is impressively fast, helping to minimize wait times.
The device is built with advanced imaging technology, which enhances the sharpness and clarity of the printed material. This ensures that even fine details are accurately represented, making it an excellent choice for producing marketing materials, presentations, and other important documents.
Security is a significant concern in today’s business landscape, and the Toshiba 3520C offers several features to mitigate risks. It supports secure print functions, user authentication, and document encryption, helping businesses protect sensitive information and maintain compliance with data protection regulations.
Connectivity options are plentiful, with USB, Ethernet, and Wi-Fi capabilities. This flexibility allows users to connect easily from various devices, whether they are on-site or working remotely. The Toshiba e-BRIDGE technology enhances this connectivity, providing seamless integration with cloud services and mobile printing applications.
Another standout characteristic of the Toshiba 3520C is its environmentally friendly design. Toshiba is committed to sustainability, and this model reflects that ethos with energy-saving features, low emissions, and recyclable components.
In summary, the Toshiba 3520C multifunction printer combines high-speed printing with quality output, versatile functionalities, and strong security features. It is an ideal solution for organizations seeking a reliable and efficient printing system to support their daily operations.

