Chapter 2 - Software Overview | Measurement Status and Displays |
Meaurement Status and Displays
Measurement Status window
The measurement status window displays all of the current Measurement parameters and will update automatically During the measurement process.
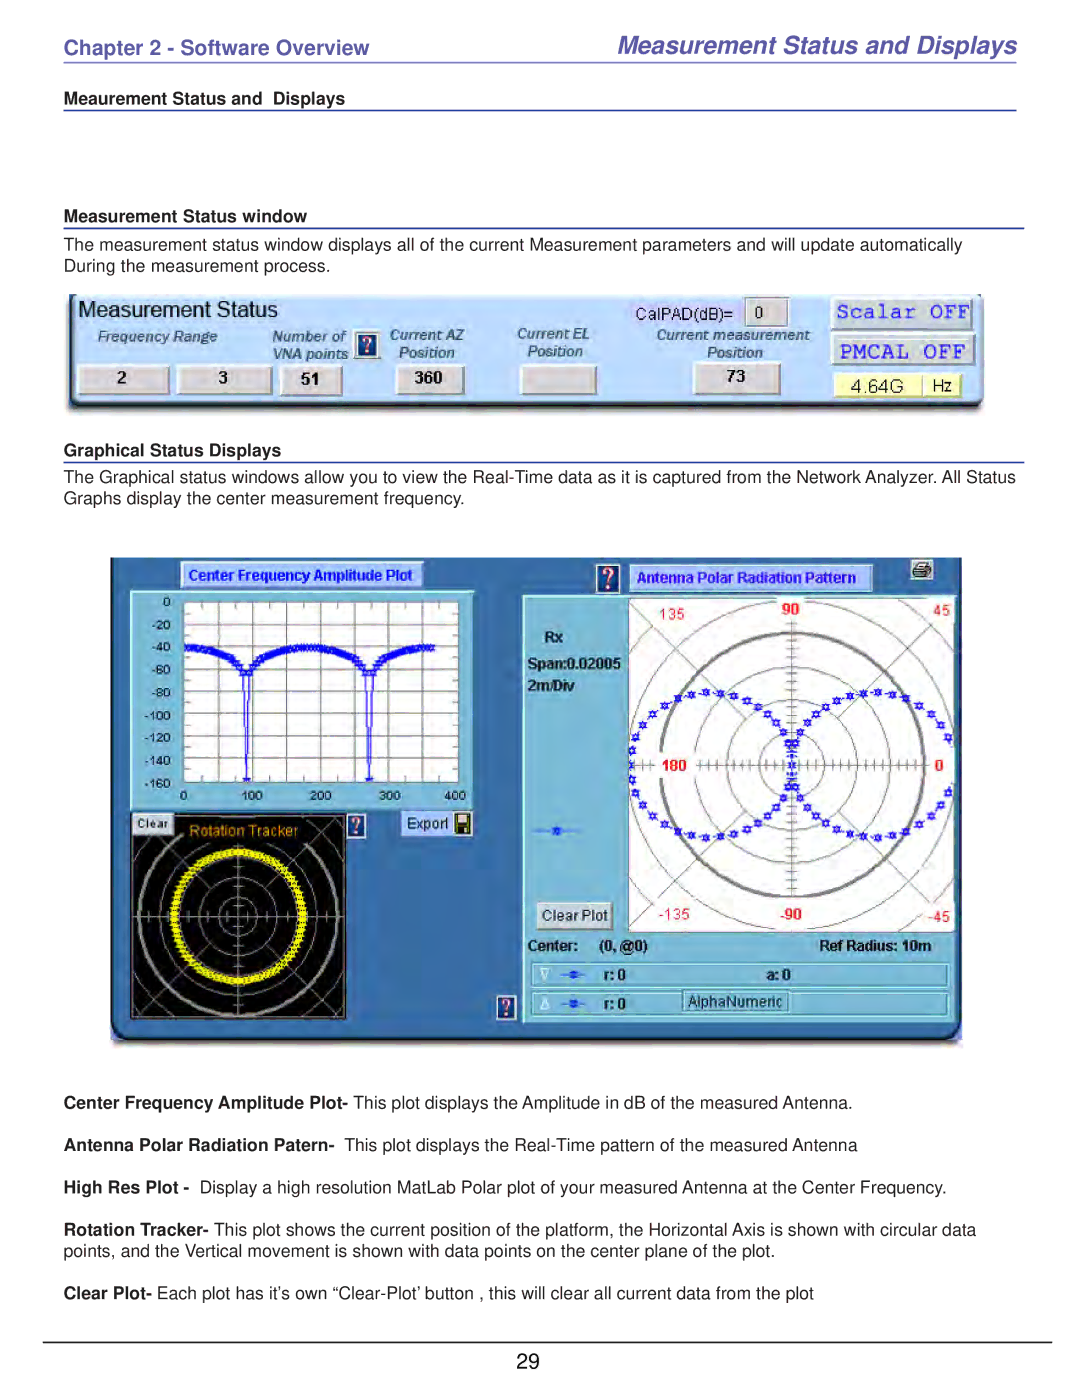
Graphical Status Displays
The Graphical status windows allow you to view the
Center Frequency Amplitude Plot- This plot displays the Amplitude in dB of the measured Antenna.
Antenna Polar Radiation Patern- This plot displays the
High Res Plot - Display a high resolution MatLab Polar plot of your measured Antenna at the Center Frequency.
Rotation Tracker- This plot shows the current position of the platform, the Horizontal Axis is shown with circular data points, and the Vertical movement is shown with data points on the center plane of the plot.
Clear Plot- Each plot has it’s own
29