Chapter 4 - Using the Data Processing Feature | Data Processing Feature |
Viewing and working with the Dynamic Amplitude Plot
Follow the Instructions below to view your data using the Dynamic Amplitude Plot located in the Data Processing feature of the software. Remember, The Dynamic Amplitude Plot will only plot the data that is contained in the Active Register.
Instructions:
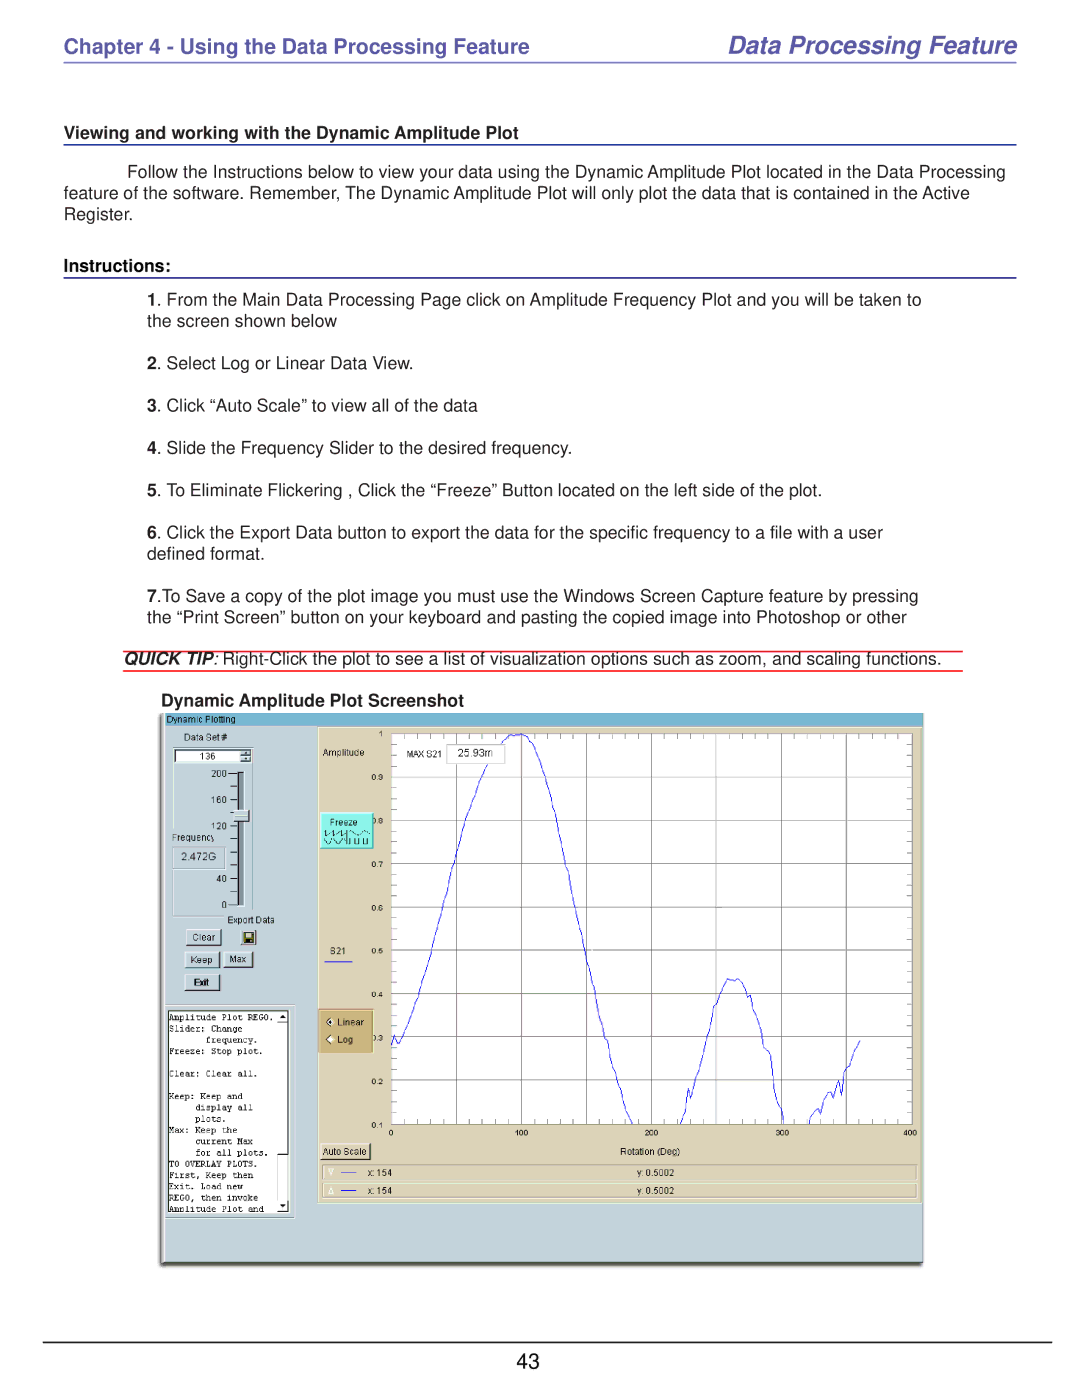
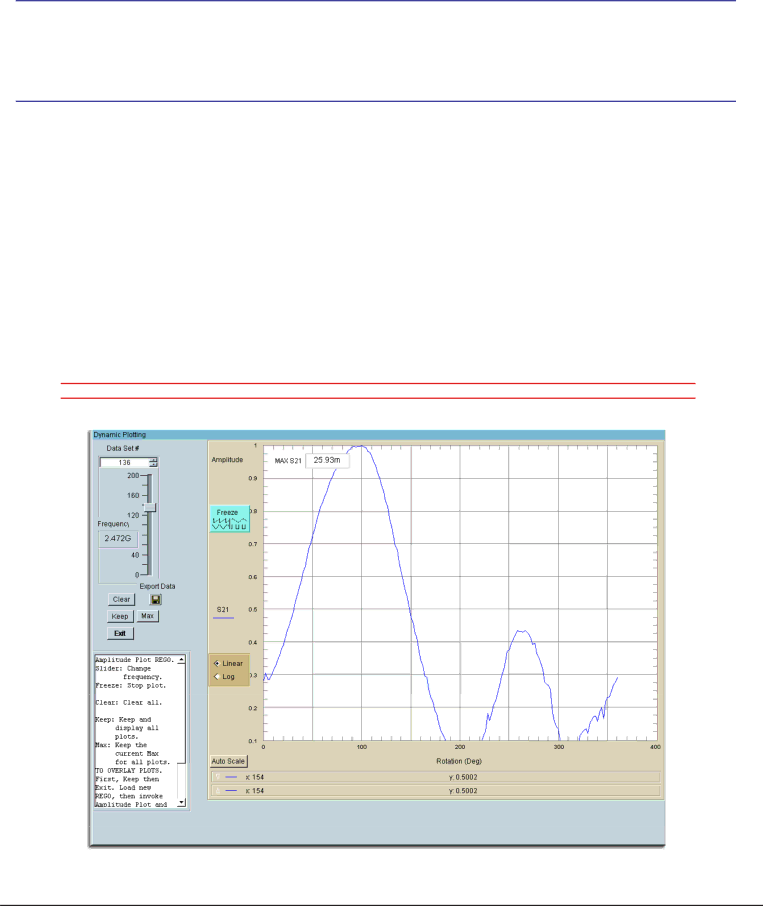
1. From the Main Data Processing Page click on Amplitude Frequency Plot and you will be taken to the screen shown below
2. Select Log or Linear Data View.
3. Click “Auto Scale” to view all of the data
4. Slide the Frequency Slider to the desired frequency.
5. To Eliminate Flickering , Click the “Freeze” Button located on the left side of the plot.
6. Click the Export Data button to export the data for the specific frequency to a file with a user defined format.
7.To Save a copy of the plot image you must use the Windows Screen Capture feature by pressing the “Print Screen” button on your keyboard and pasting the copied image into Photoshop or other
QUICK TIP:
Dynamic Amplitude Plot Screenshot
43