Chapter 4 - Using the Data Processing Feature | Data Processing Feature |
Viewing and working with measurements in 3D
Press any of the 3D Buttons to View the “Active Register” Data in 3D Using the MatLab Viewing Interface.
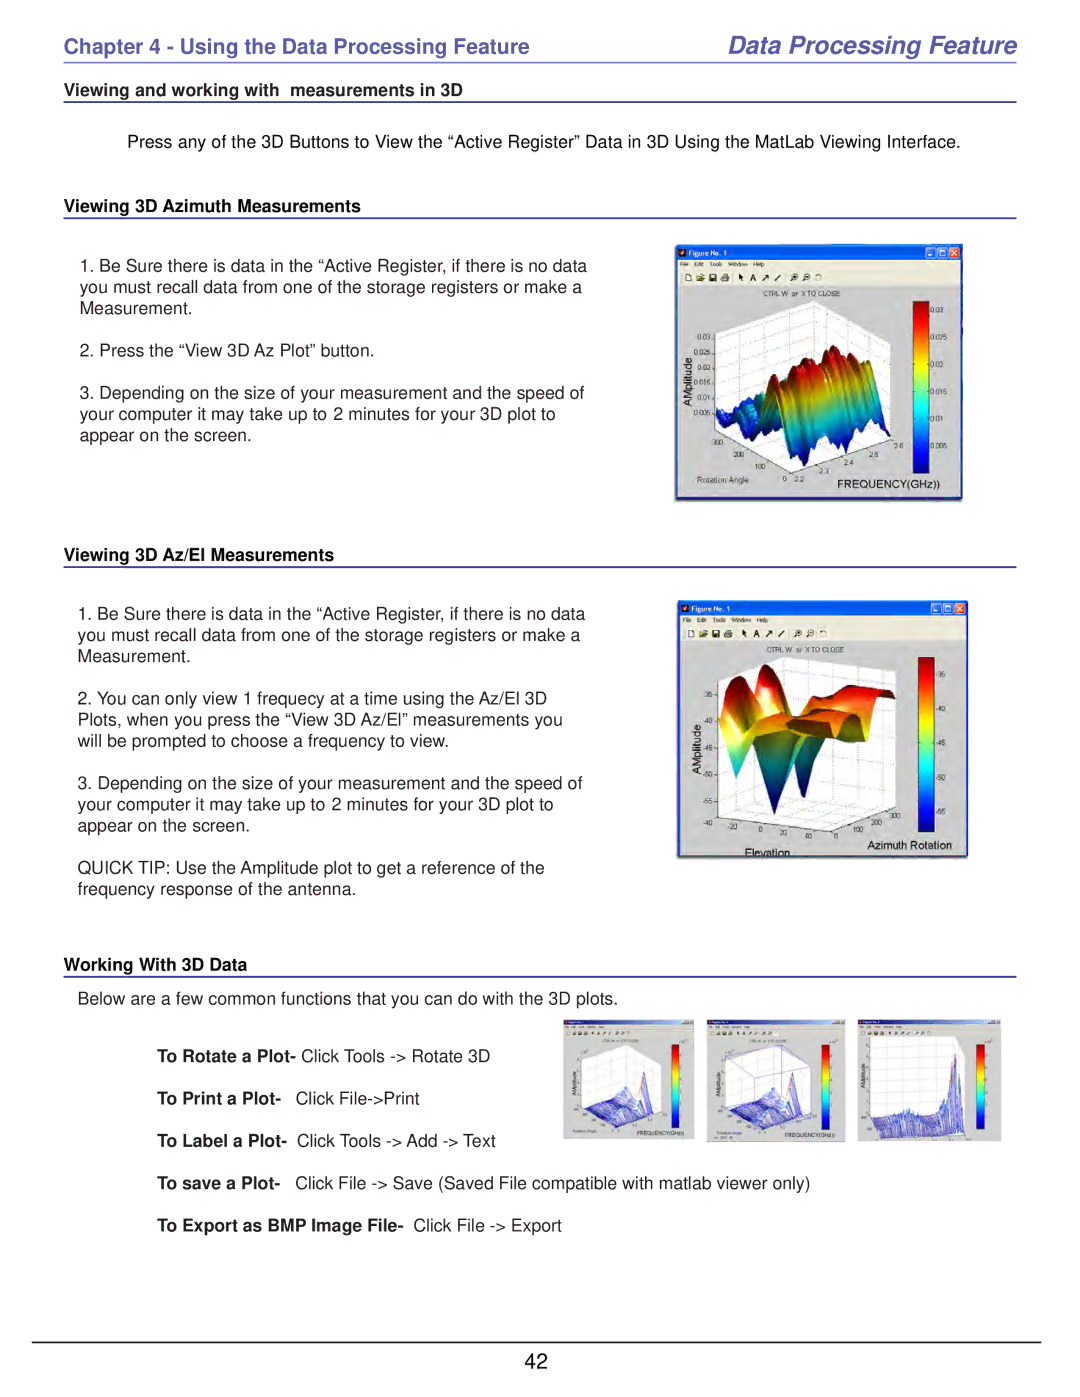
Viewing 3D Azimuth Measurements
1.Be Sure there is data in the “Active Register, if there is no data you must recall data from one of the storage registers or make a Measurement.
2.Press the “View 3D Az Plot” button.
3.Depending on the size of your measurement and the speed of your computer it may take up to 2 minutes for your 3D plot to appear on the screen.
Viewing 3D Az/El Measurements
1.Be Sure there is data in the “Active Register, if there is no data you must recall data from one of the storage registers or make a Measurement.
2.You can only view 1 frequecy at a time using the Az/El 3D Plots, when you press the “View 3D Az/El” measurements you will be prompted to choose a frequency to view.
3.Depending on the size of your measurement and the speed of your computer it may take up to 2 minutes for your 3D plot to appear on the screen.
QUICK TIP: Use the Amplitude plot to get a reference of the frequency response of the antenna.
Working With 3D Data
Below are a few common functions that you can do with the 3D plots.
To Rotate a Plot- Click Tools
To Print a Plot- | Click |
To Label a Plot- | Click Tools |
To save a Plot- Click File
To Export as BMP Image File- Click File -> Export
42