NETGEAR, Inc
Trademarks
World Wide Web
Page
Contents
Chapter Wireless Configuration
Chapter Advanced Configuration
Viii Contents
Glossary Index
Contents
List of Procedures
Page
Audience
Preface About This Guide
Technical Support
Special Message Formats
Typographical Conventions
Chapter Introduction
Key Features
About the Gateway
Powerful, True Firewall
802.11b Standards-based Wireless Networking
Auto Sensing and Auto Uplink LAN Ethernet Connections
Content Filtering
Protocol Support
Easy Installation and Management
Introduction
Gateway’s Front Panel
What’s in the Box?
LED Descriptions
DG824M Rear Panel
Gateway’s Rear Panel
What You Will Need Before You Begin
Connecting the Gateway to the Internet
Cabling Requirements
Internet Configuration Requirements
LAN Configuration Requirements
Where Do I Get the Internet Configuration Parameters?
Computer Hardware Requirements
Connecting the Gateway to the Internet
Procedure 2-1 Record Your Internet Connection Information
Procedure 2-2 Connecting the Gateway
Connect the DG824M
Connect the Ethernet cable B Port to a computer
Log in to the DG824M
Connect to the Internet
Connecting the DG824M to the Internet
Built-in Web-based Configuration Manager Setup Wizard
Procedure 2-3 Auto-Detecting Your Internet Connection Type
Setup Wizard menu for PPPoE login accounts
Procedure 2-4 Wizard-Detected PPPoE Login Account Setup
Setup Wizard menu for PPPoA login accounts
Procedure 2-5 Wizard-Detected PPPoA Login Account Setup
Connecting the Gateway to the Internet
Setup Wizard menu for Dynamic IP address
Procedure 2-6 Wizard-Detected Dynamic IP Account Setup
10 Setup Wizard menu for Fixed IP address
Procedure 2-7 Wizard-Detected Fixed IP Static Account Setup
Testing Your Internet Connection
11 Browser-based configuration Basic Settings menu
Manually Configuring Your Internet Connection
Procedure 2-8 Manual Configuration
Connecting the Gateway to the Internet
Connecting the Gateway to the Internet
Considerations For a Wireless Network
Chapter Wireless Configuration
Observe Placement and Range Guidelines
Implement Appropriate Security
Wireless Settings menu
Wireless Settings
Identification
Procedure 3-1 Configuring Basic Wireless Network Settings
Using the Wireless Access by MAC Address Feature
Wireless Access menu
Procedure 3-2 Restricting Wireless Access by MAC Address
Wireless WEP menu
Configuring Wired Equivalent Privacy WEP
Wireless Settings menu, WEP selected
Configuring WEP Wired Equivalent Privacy
Wireless Configuration
Chapter Protecting Your Network
Procedure 4-1 Changing the Built-In Password
Set Password menu
Procedure 4-1 Changing the Administrator Login Timeout
Blocking Keywords, Sites, and Services
Configuring Basic Firewall Services
Procedure 4-2 Block Keywords and Sites
Click on the Block Sites link of the Security menu
Rules
Rules menu
Inbound Rule Example a Local Public Web Server
Inbound Rules Port Forwarding
WAN Users
Considerations for Inbound Rules
Outbound Rule Example Blocking Instant Messenger
Outbound Rules Service Blocking
Protecting Your Network
Rules table with examples
Order of Precedence for Rules
Procedure 4-3 Define Services
Services
Procedure 4-4 Setting Your Time Zone
Setting Times and Scheduling Firewall Services
11 Schedule Services menu
Procedure 4-5 Scheduling Firewall Services
Procedure 5-6 Backup the Configuration to a File
Backing Up, Restoring, or Erasing Your Settings
Chapter Managing Your Network
Settings Backup menu
Procedure 5-8 Erase the Configuration
Procedure 5-7 Restore a Configuration from a File
Upgrading the Gateway’s Firmware
Gateway Upgrade menu
Procedure 5-1 Gateway Upgrade
Viewing Gateway Status and Usage Statistics
Network Management Information
This screen shows the following parameters
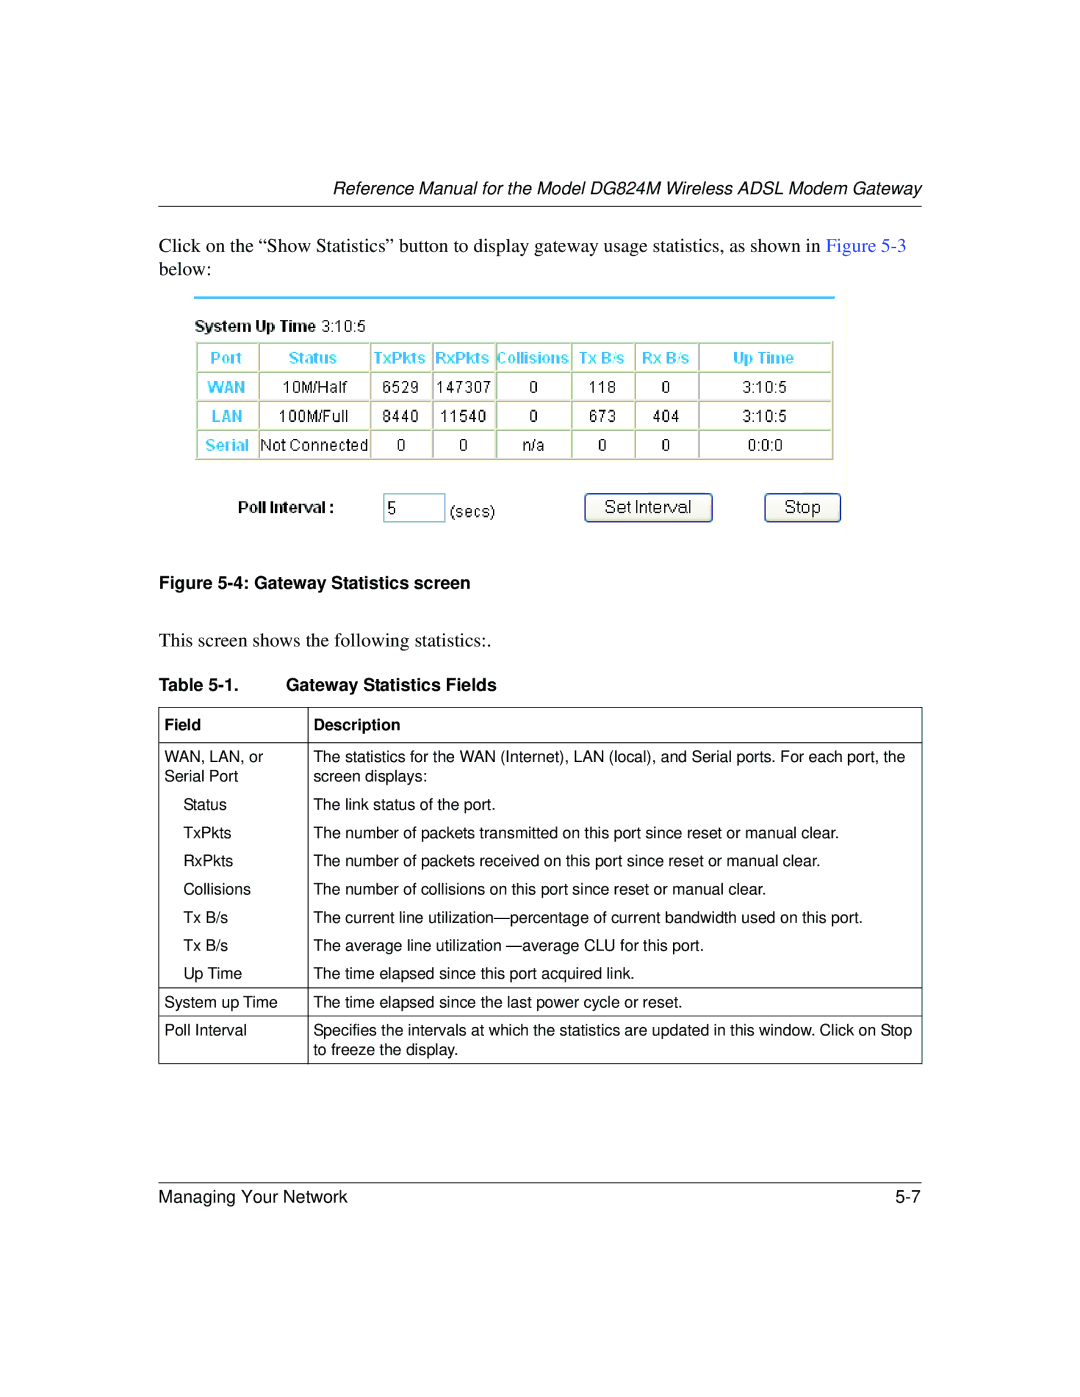
This screen shows the following statistics
Gateway WAN Status screen
Attached Devices menu
Viewing Attached Devices
Security Logs menu
Viewing, Selecting, and Saving Logged Information
Selecting What Information to Log
Saving Log Files on a Server
Examples of log messages
Enabling Security Event E-mail Notification
Managing Your Network
Diagnostics menu
Running Diagnostic Utilities and Rebooting the Router
Enabling Remote Management
Procedure 5-2 Configure Remote Management
Http//134.177.0.1238080
Managing Your Network
Configuring Advanced Security
Chapter Advanced Configuration
Setting Up a Default DMZ Server
Respond to Ping on Internet WAN Port
Procedure 6-1 Configuring a Default DMZ Server
LAN TCP/IP Setup
Configuring LAN IP Settings
MTU Size
Use Gateway as Dhcp server
Reserved IP addresses
Procedure 6-1 Configure LAN TCP/IP Setup
Configuring Dynamic DNS
Procedure 6-2 Configure Dynamic DNS
Static Route Example
Using Static Routes
Static Routes Table
Procedure 6-3 Configuring Static Routes
Advanced Configuration
Advanced Configuration
Basic Functioning
Chapter Troubleshooting
Test LED Never Turns On or Test LED Stays On
Power LED Not On
LAN or WAN Port LEDs Not On
Troubleshooting the Web Configuration Interface
Adsl link
Troubleshooting the ISP Connection
WAN LED Off
Obtaining a WAN IP Address
Troubleshooting Internet Browsing
Troubleshooting PPPoE or PPPoA
Testing the LAN Path to Your Router
Troubleshooting a TCP/IP Network Using the Ping Utility
Testing the Path from Your PC to a Remote Device
Problems with Date and Time
Restoring the Default Configuration and Password
Using the Default Reset button
Troubleshooting
Appendix a Technical Specifications
LAN
Related Publications Basic Router Concepts
Appendix B Network and Routing Basics
Routing Information Protocol
What is a Router?
IP Addresses and the Internet
Three Main Address Classes
Equals
Netmask
Example of Subnetting a Class B Address
Subnet Addressing
Netmask Notation Translation Table for One Octet
Private IP Addresses
Single IP Address Operation Using NAT
Single IP Address Operation Using NAT
Related Documents
MAC Addresses and Address Resolution Protocol
Domain Name Server
IP Configuration by Dhcp
Ethernet Cabling
Uplink Switches and Crossover Cables
Internet Security and Firewalls
What is a Firewall?
Cable Quality
Denial of Service Attack
Wireless Networking
Wireless Network Configuration
Stateful Packet Inspection
Ad Hoc Mode Peer-to-Peer Workgroup
Extended Service Set Identification Essid
Wireless Channel Selection
Authentication and WEP Encryption
Radio frequency channels used are listed in Table
Preparing Your Computers for TCP/IP Networking
Appendix C Preparing Your Network
Install or Verify Windows Networking Components
Configuring Windows 95, 98, and Me for TCP/IP Networking
Reference Manual for the Model RP614 Web Safe Router
Locate your Network Neighborhood icon
Primary Network Logon is set to Windows logon
Verifying TCP/IP Properties
Selecting Windows’ Internet Access Method
Configuring Windows NT4, 2000 or XP for IP Networking
Dhcp Configuration of TCP/IP in Windows XP
Dhcp Configuration of TCP/IP in Windows XP, 2000, or NT4
Reference Manual for the Model RP614 Web Safe Router
Dhcp Configuration of TCP/IP in Windows
Reference Manual for the Model RP614 Web Safe Router
Obtain an IP address automatically is selected
Dhcp Configuration of TCP/IP in Windows NT4
Reference Manual for the Model RP614 Web Safe Router
TCP/IP Properties dialog box now displays
Verifying TCP/IP Properties for Windows XP, 2000, and NT4
MacOS 8.6 or
Configuring the Macintosh for TCP/IP Networking
MacOS
Verifying TCP/IP Properties for Macintosh Computers
What Is Your Configuration Information?
Are Login Protocols Used?
Verifying the Readiness of Your Internet Account
Select the Gateway tab
Reference Manual for the Model RP614 Web Safe Router
Restarting the Network
Reference Manual for the Model RP614 Web Safe Router
See Asymmetric Digital Subscriber Line
Glossary
Router addresses
See Network Address Translation
See netmask
Numerics
Index
Ietf B-1
RFC
Index