NETGEAR
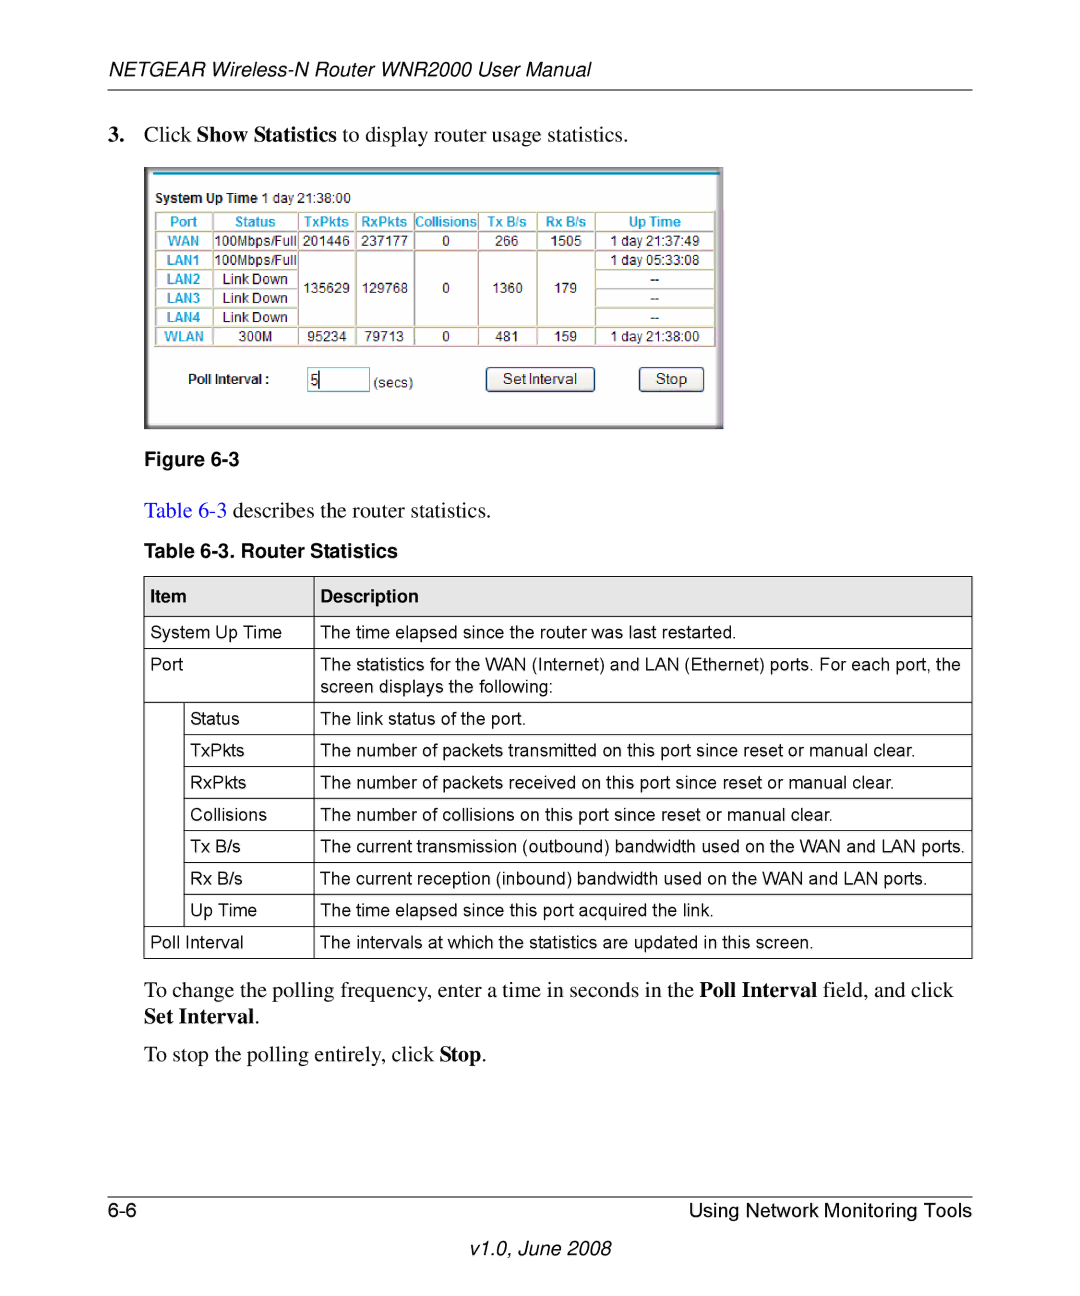
3.Click Show Statistics to display router usage statistics.
Figure
Table
Table 6-3. Router Statistics
Item | Description | |
|
|
|
System Up Time | The time elapsed since the router was last restarted. | |
|
| |
Port | The statistics for the WAN (Internet) and LAN (Ethernet) ports. For each port, the | |
|
| screen displays the following: |
|
|
|
| Status | The link status of the port. |
|
|
|
| TxPkts | The number of packets transmitted on this port since reset or manual clear. |
|
|
|
| RxPkts | The number of packets received on this port since reset or manual clear. |
|
|
|
| Collisions | The number of collisions on this port since reset or manual clear. |
|
|
|
| Tx B/s | The current transmission (outbound) bandwidth used on the WAN and LAN ports. |
|
|
|
| Rx B/s | The current reception (inbound) bandwidth used on the WAN and LAN ports. |
|
|
|
| Up Time | The time elapsed since this port acquired the link. |
|
|
|
Poll Interval | The intervals at which the statistics are updated in this screen. | |
|
|
|
To change the polling frequency, enter a time in seconds in the Poll Interval field, and click Set Interval.
To stop the polling entirely, click Stop.
Using Network Monitoring Tools |
