1.5
1
130
0.5
125 Pixels
0
105
125105
130
Pixels
Diffusion Measurement Package
This optional software module enables data acquisition and analysis to investigate the molecular interaction and concentrations by calculating the diffusion coefficients of molecules within the cell.
Diverse analysis methods (RICS/ccRICS, point FCS/point FCCS and FRAP) cover a wide range of molecular sizes and speeds.
RICS—Raster Imaging Correlation Spectroscopy
Raster image correlation spectroscopy (RICS) is a new method for analyzing the diffusion and binding dynamics of molecules in an entire, single image. RICS uses a spatial correlation algorithm to calculate diffusion coefficients and the number of molecules in specified regions.
Cross correlation RICS (ccRICS) characterizes molecular interactions using fluorescent- labeled molecules in two colors.
point FCS—Point scan Fluorescence Correlation Spectroscopy
point scan fluorescence correlation spectroscopy (point FCS) analyzes intensity fluctuations caused by diffusion or binding/unbinding interactions of a protein complex. point FCS uses an auto correlation function to carry out operations on fluorescence signals obtained by continuous scanning of a single pixel on the screen.
point scan fluorescence
point FCS and point FCCS can now be performed with a standard detector, eliminating the need for a special
FRAP Analysis
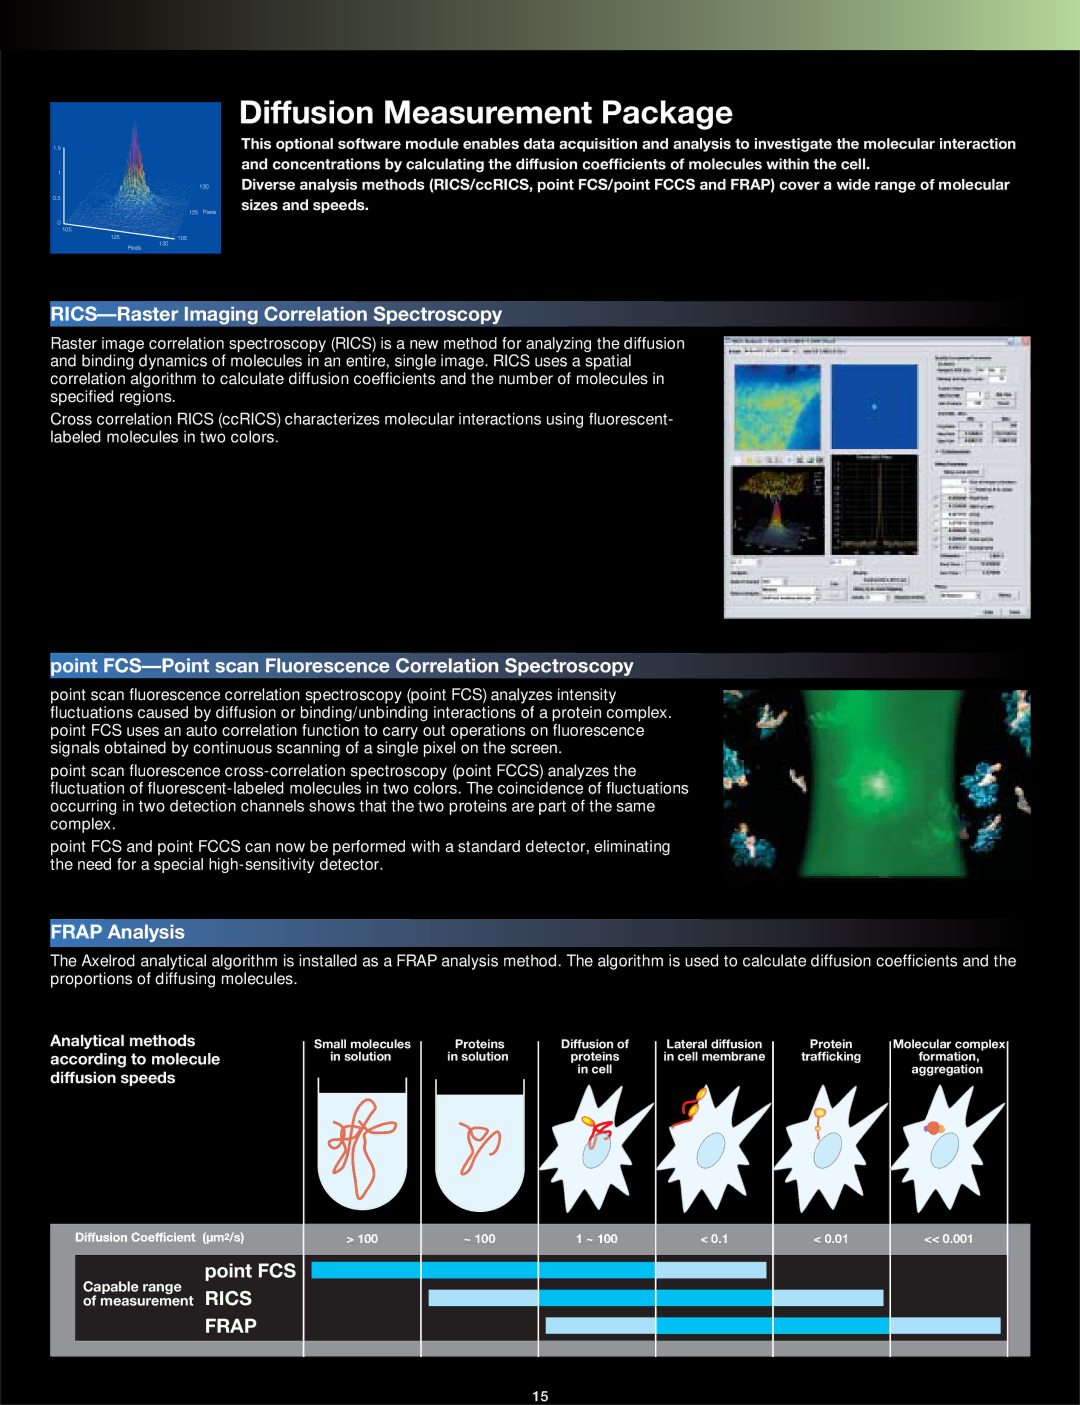
The Axelrod analytical algorithm is installed as a FRAP analysis method. The algorithm is used to calculate diffusion coefficients and the proportions of diffusing molecules.
Analytical methods according to molecule diffusion speeds
point FCS
Capable range
of measurement RICS
FRAP
Small molecules in solution
> 100
Proteins in solution
~ 100
Diffusion of proteins in cell
1 ~ 100
Lateral diffusion in cell membrane
< 0.1
Protein trafficking
< 0.01
Molecular complex
formation, aggregation
<< 0.001
15
