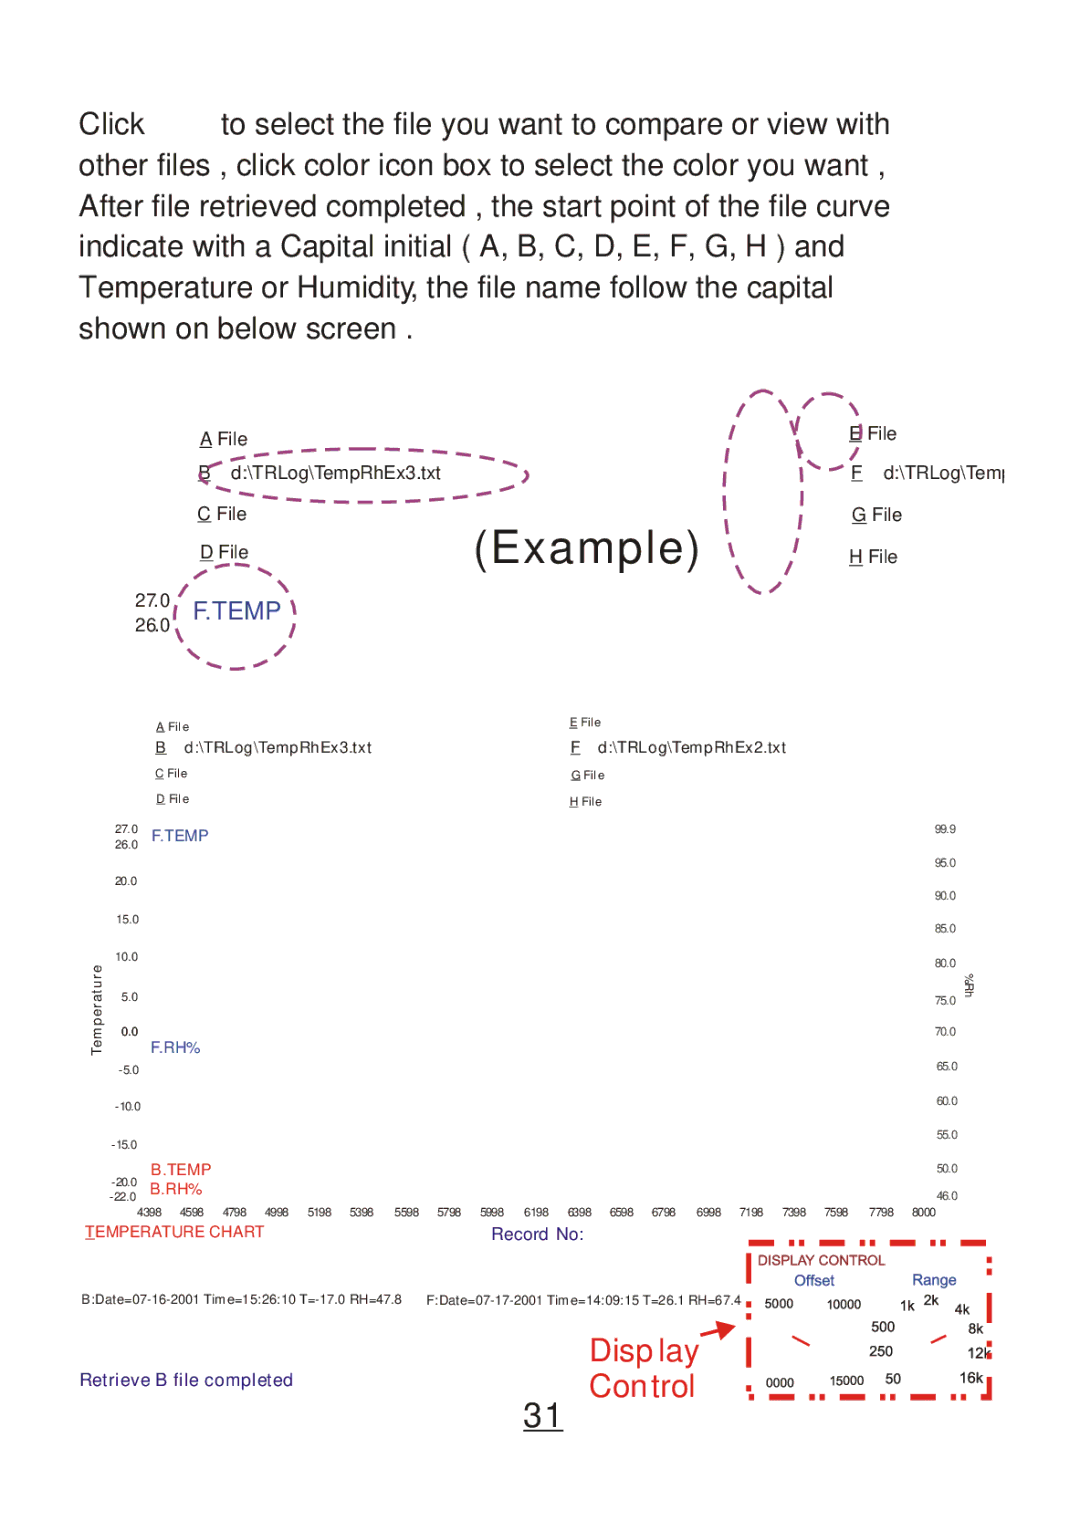
Click | to select the file you want to compare or view with | ||
other files , click color icon box to select the color you want , | |||
After file retrieved completed , the start point of the file curve | |||
indicate with a Capital initial ( A, B, C, D, E, F, G, H ) and |
| ||
Temperature or Humidity, the file name follow the capital |
| ||
shown on below screen . |
|
| |
Group File Monitor |
|
| |
| A File |
| E File |
| B d:\TRLog\TempRhEx3.txt |
| F d:\TRLog\Temp |
| C File | (Example) | G File |
| D File | H File | |
27.0 | F.TEMP |
|
|
26.0 |
|
| |
|
|
| |
Group File Monitor |
|
| |
A File | E File |
| |
B | d:\TRLog\TempRhEx3.txt | F d:\TRLog\TempRhEx2.txt |
|
C File | G File |
| |
D File | H File |
| |
| 27.0 | F.TEMP |
|
|
|
|
|
|
|
|
|
|
|
|
|
|
|
| 99.9 | |
| 26.0 |
|
|
|
|
|
|
|
|
|
|
|
|
|
|
|
|
| ||
|
|
|
|
|
|
|
|
|
|
|
|
|
|
|
|
|
|
|
| |
|
|
|
|
|
|
|
|
|
|
|
|
|
|
|
|
|
|
|
| 95.0 |
| 20.0 |
|
|
|
|
|
|
|
|
|
|
|
|
|
|
|
|
|
| 90.0 |
|
|
|
|
|
|
|
|
|
|
|
|
|
|
|
|
|
|
|
| |
| 15.0 |
|
|
|
|
|
|
|
|
|
|
|
|
|
|
|
|
|
| 85.0 |
|
|
|
|
|
|
|
|
|
|
|
|
|
|
|
|
|
|
|
| |
Temperature | 10.0 |
|
|
|
|
|
|
|
|
|
|
|
|
|
|
|
|
|
| 80.0 |
|
|
|
|
|
|
|
|
|
|
|
|
|
|
|
|
|
|
| ||
5.0 | F.RH% |
|
|
|
|
|
|
|
|
|
|
|
|
|
|
|
| 75.0 | ||
| 0.0 |
|
|
|
|
|
|
|
|
|
|
|
|
|
|
|
|
|
| 70.0 |
|
|
|
|
|
|
|
|
|
|
|
|
|
|
|
|
|
|
| 65.0 | |
|
|
|
|
|
|
|
|
|
|
|
|
|
|
|
|
|
| 60.0 | ||
|
|
|
|
|
|
|
|
|
|
|
|
|
|
|
|
|
|
| ||
|
|
|
|
|
|
|
|
|
|
|
|
|
|
|
|
|
|
| 55.0 | |
|
|
|
|
|
|
|
|
|
|
|
|
|
|
|
|
|
|
|
| |
| B.TEMP |
|
|
|
|
|
|
|
|
|
|
|
|
|
|
|
| 50.0 | ||
| B.RH% |
|
|
|
|
|
|
|
|
|
|
|
|
|
|
|
| 46.0 | ||
|
|
|
|
|
|
|
|
|
|
|
|
|
|
|
|
| ||||
|
| 4398 | 4598 | 4798 | 4998 | 5198 | 5398 | 5598 | 5798 | 5998 | 6198 | 6398 | 6598 | 6798 | 6998 | 7198 | 7398 | 7598 | 7798 | 8000 |
TEMPERATURE CHART |
|
|
|
| Record No: |
|
|
|
|
|
|
|
| |||||||
![]()
![]()
![]()
%Rh
Retrieve B file completed
Display Control
31
