Sony G90 Size Does Matter
Ingly just beyond reach
Than ever we needed in strange, dark caves
Experience before he finds a little of It
Sound and vision at the same time every time
Kubrick’s Eyes Wide Shut HP
Bergman’s The Seventh Seal DVD
Follies & Frolics
Barco Vision Watch
Editors will respond next issue
Can All That Counts Be Counted? a Forum Begins
II Janet’s Index
Editor
If The Perfect Vision is to push
Problem with DVD Digital Artifacts
Targeting 14-Year-Old Boys?
Azine Widescreen Review perhaps?
Down Primrose Path Toward Perfect Vision Forever?
At all. So it doesn’t take Hdtv or
What Not To See on DVD
Digital Cinema The Good Bad of It
John Eargle Lossy Data Compression & DVD Sound
TV Is TV
I L L E R
Series such as Star Trek The Next Generation . Each
E G
Movie Trivia
DVDs Gaining Momentum
S I C & M U L T I M E D I a
E G S a N D O W
M M a R T I N
Panasonic DVD-L50D PalmTheater
ViaTV VC 105 Videophone
R R Y R a W L I N S O N
Encountered
Infocomm
Report
Significant New Products and Trends
World of displays
To recreate the theater experience in the home
Ogy near its limit and its days are numbered. The display
Light projected on the screen. These considerations have
Tunately, there are trade-offs for the small size of ultra
An Ideal Cinema?
Real movie where there was none before, or at least
Ometimes I think that every position on a
Moviemaking crew comes with its special privi
Leges, its perks, as it were. If you’re the script super
One way or another when it comes to working with
Ity between when they are and when
Assistant directors, service people,
Footage
Certainly a serviceable way to edit
Movies
Likely to get you
Directors seem to trust me to use my Into any trouble
Allowing for camera setups, lighting, and rig
Takes and setups meaning the master
It’s a funny thing about matching in editing. Most lay
Enjoy prelaps to pull the narrative
Sion? In Understanding Media, McCluhan
R L E Y
Lexicon MC-1 Controller
Sonic Flavors To Slake Every Thirst
Listening to Movies
Logic 7 Digital Signal Processing for Movies and Music
Lexicon’s Music Surround Modes
Listening To Music Surround
Conclusion
Ing the Denon Anechoic Orchestral Music Recording CD
Controllers
DSP and the Future-Proof Controller
Two-Channel Bypass Mode
Surround Decoding and Digital Signal Processing DSP
THX-Certified Controllers
Bass Management
High-Resolution Digital Audio
…the controller represents
Radical new path to
Future…
After DSP Digital to Analog Conversion
InterFacing the User
Revel Ultima Speakers From 2 to 7.1 Channels
Episode One The Ancient Enemy
Meet My Enemy
M M I I L L E R
Deploying the Troops RPG Room Optimizer Software
59 by
Revel Ultima Salon Noble Warrior
Start and go get a beer, or two
You wanted to cross over your subwoofer at 40 Hz
Tion coefficient for the surfaces that is comparable to
Our noble warrior against the ancient enemy
Likewise for the 15-inch woofer in the Sub-15
Essary to achieve the Revel design team’s led by Kevin
Research effort to quantify in-room speaker behavior
Direct radiator to bloated. The Salon’s soundstage com
By Keith Johnson for Reference Recordings
Nal processing in controllers hadn’t made subwoofer
Speaker? Removing the bottom octave from the Salon’s
Formance. Orchestral music, for example, is performed
Woofer, when it is well integrated with your main speakers
Cians often use emphasis in the intensity
Cy, phase, and time. It then develops adaptive filters that
Battle Summary Stand-off
Episode Two a War On Two Fronts
Get that the fight for the lowlands was far from over
LINN-AV5103 Aktiv Multi-Channel System
Search of the Mythical Beast
Company of the Beast
Quest Begins
Working the Environment
Remote Interface
NAD T770 Audio-Video Receiver
Just the Basics, Done Well
Summing Up
I L G a D E R
Das Boot, The Director’s Cut Wolfgang Peterson, director
Gaines’ Stormy Monday I’ve Got the T-Bone Walker
Steering in DD mode is precise and smooth
Manufacturer’s Corner
RPG Diffuser Systems Inc., Room Optimizer
Designs go, the NAD T770 is all steak
I D I W a L E S O N
Want My DVD
Major Labels’ Plans for Classical Music on DVD
Tan Opera Guide to Opera on Video and executive direc
Audience, he says. We fed that information to the rear
Tion from the main mikes as well as the spot mikes
From the two main mikes and brought it to the rear ones
Have been considered typical indeed, good for a
See review, this issue
Quering technology issues, Moorhead says. Most of our
Fall was so high. This was an elaborate joint
Computer and TV combined
Stars. God, was I skeptical
Made for DVD
Original, so they’re not going to fake it for DVD
Dramatic confrontation, in the second scene of Act Two
Must answer three riddles. If his answers are correct, she
To Turandot’s collection the Chinese nation, ruled by an
Ple either turning cynical, or lusting for more blood
Turandot. And why would there be? Yes, Puccini conscien
Preoccupation like that made more sense, but
Tucks into a tiny corner of the staging. Hordes of Chinese
Moon onstage we see a corps of Chinese dancers, wearing
Classical DVD Sampler
DVD-ness
Ment of that, and when I listened, I found I’d choose
With the sound either way, or with the sound of the Scala
Full of pomp and circumstance, but much less lifelike
Performances
Role mostly as a force of nature, powerful but blank
Start of each one, there’s Karajan on screen, his face
Like institutional persona, Herr Music Director of All
That’s simply ravishing This performance is broad
Roger Reynolds Watershed Mode 70, DVD
Surrounded
Jargon
Experiment in a New Medium
Are so new that we all need orientation
Though, is that Reynolds is way too impressed with
Yes, theorists can find all sorts of relationships among
Areas of music rhythm, loudness, and tone color, for
Musical score
Maybe, succeeded by metallic effects
But in rhythms he himself creates. In practice, these, to
That, while Otto is allegedly creating syntax by moving
Pop With a Twist
B G E N D R O N
Ments of a Clockwork Orange What Ever Happened to Baby
Performance we see on DVD begins with a film
Perfect timing and careful choreography
Below-average vocal performance
Son’s Dead to the World. Nope
Horizon, probably to his death. It is a scene that demands
DVD, with its digitally clear resolution
Tabloid, because of its sensational pur
Insignificance of the media and with a
Ly slurs the tune’s climactic line,What
Dent films Gods and Monsters, Cookie’s Fortune that
Godzilla, Armageddon, Instrument is better than
With 1991’s In on the Kill
D R E W Q U I N T
Close Encounter
Voices of Light/The Passion of Joan of Arc
Special presentation of Voices of Light/The Passion of Joan
Obvious. The movie is about as complete as it can be.
Other instances, were not merely happy coincidences, nor
Each other. Seen together, they seemed inseparable yet
By much of the sound reinforcement heard in Broadway
An Introduction to Digital Video
Part 2 Video Color Concepts
Physics of Color
Human Color Perception
Colorblindness
Color Concepts for Video Additive Color
Luminance
Hue and Saturation
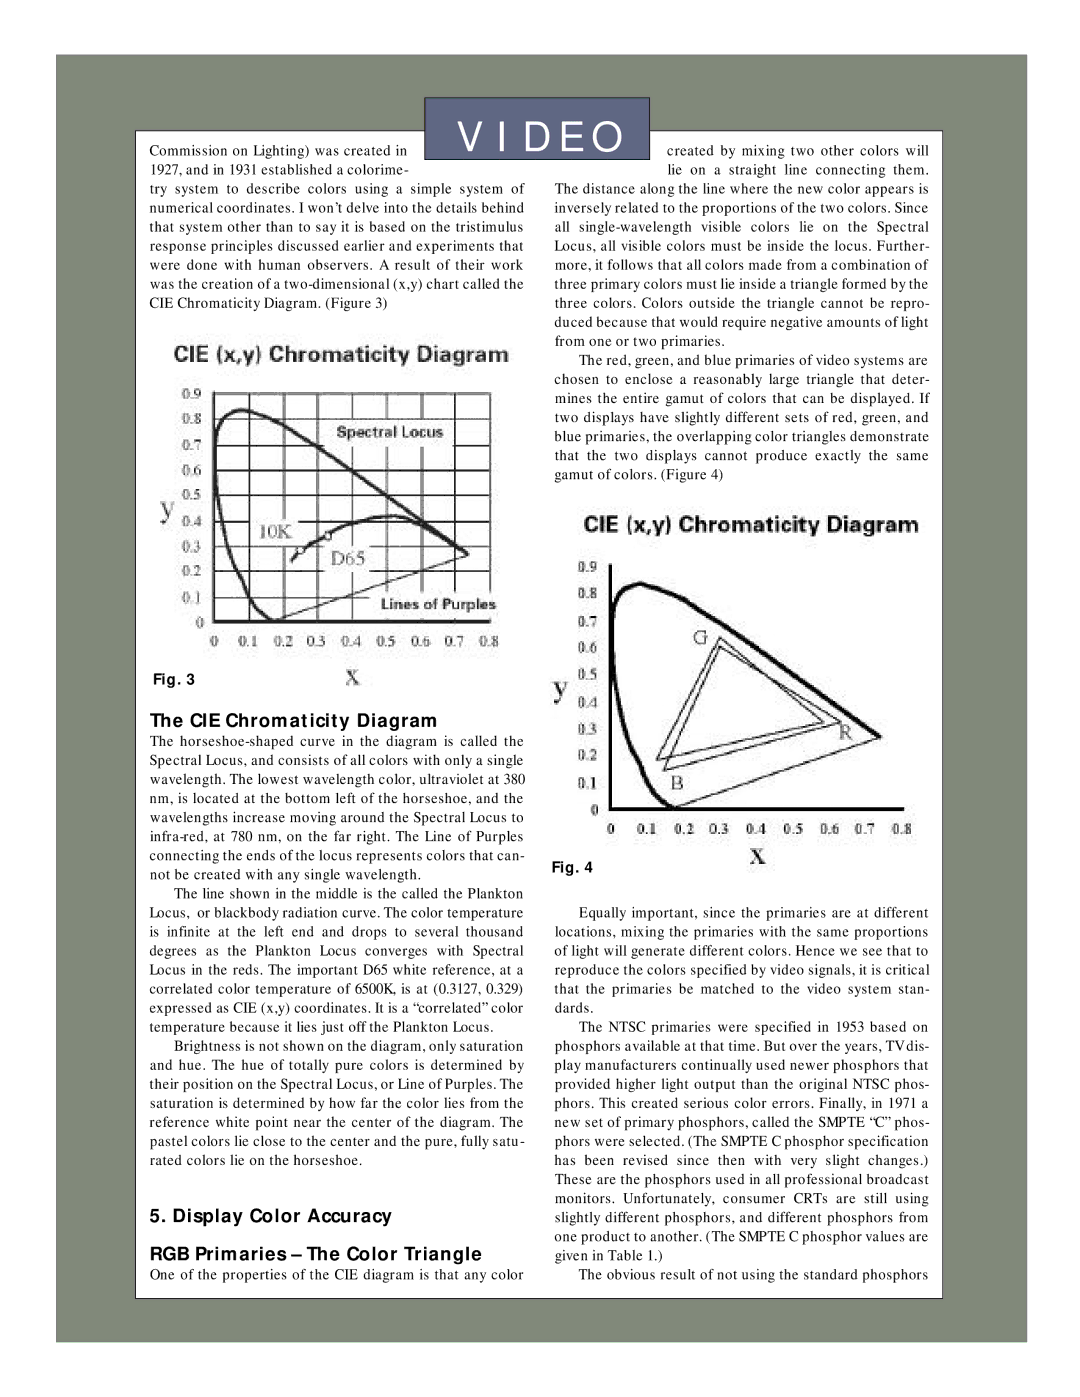
CIE Chromaticity Diagram
Display Color Accuracy RGB Primaries The Color Triangle
Color Measurement Color Bars
White Reference Color Temperature
Grayscale Color Temperature
Other color signals will also
Color errors.
Are used in some circumstances
Instrument known as a color analyzer or a spectro
Avia Guide to Home Theater pro
Adjustments
Color and Hue
E G R O G E R S
Sony VPH-G90U Multiscan Projector
Physical
Installation and Set-up
Connections
Scan Rates
Operating Functions
Performance
Summary
Description
Specifications
Runco DTV-930 Multiscan Projector
Inputs/Outputs
Convergence Labs Test Report Greg Rogers
Formats can be selected directly from the remote
Horizontal and vertical scan frequencies and other source
Be noticed
Range
Combination is about the reasonable limit to achieve an
Line Doubling = Deinterlacing
Remote Control
IEV Turboscan 1500 Line Doubler
Video outputs. As a progressive video reference, I used a
Creates progressive video without deinterlacing artifacts
Ics-grade front projector
3Dfusion do each in different ways. The Turboscan
L L C R U C E
Pioneer Elite DVL-91 Combination CD/LD/DVD Player
Look and Feel
Up menus allow you to configure such things as onscreen lan
Meaning clear
DVD Performance
LD Performance
Ly, the remote of the DVL-91, like that
Wrong one in the dark
Dvdo iScan Plus Line Doubler
Celebrate Film
Classic Comedy’s Second Coming Roberto Benigni
L M & M O V I E S
Though a number of films in which Benigni
Quently escape was Benigni’s first American and English
Roberto on the Internet
Cute cameo which perhaps hints at a sequel
Aspect ratio and running time incorrectly
Sound
Original Pink Panther film go figure. Sad to say
Special Editions Kubrick and The Space Monsters
First wave of anger and incredulity. The DVD set was
No thanks to Warner’s folks Small wonder
Set consists of Lolita, Dr. Strangelove, 2001 a
Both Clockwork and Full Metal Jacket exhibited pinkish
Special Editions Few Weird Thoughts
What Dreams May Come
Worth a Look Relatively Recent Arrivals
Navigator a Medieval Odyssey, the other is Map Human Heart
How beautiful she was when she was married to Roger
Movie would have had the solid foundation it needed
To say that the film is developing a cult following some
Smooth as could be and given the importance
Biopics Three British Royals
Love.1 As
Otranto
Man in the Iron Mask 1939. But it is his
Old Dark House 1932, The Invisible Man
HP Comments
Ic in this context in cloud cuckooland, with their
You have an idea of what’s really going on in the film
Mon with The Shining than with any other Kubrick opus
Food-storage room
From Art to Cult
N a T H a N V a L I N
Only later goes on to give them human dimensions. Even
Such blatant symbolism can sustain an entire movie
Not content to present us with an allegory of the eternal
Face the questions that vexed and haunted
Issues 111
Back Issues Website Change of Address
Questions About Your Subscription
Letters to the Editor
Editorial Submissions
A S S I F I E D a D O R D E R F O R M
Name Company Address CITY, State , ZIP
Vision Watch