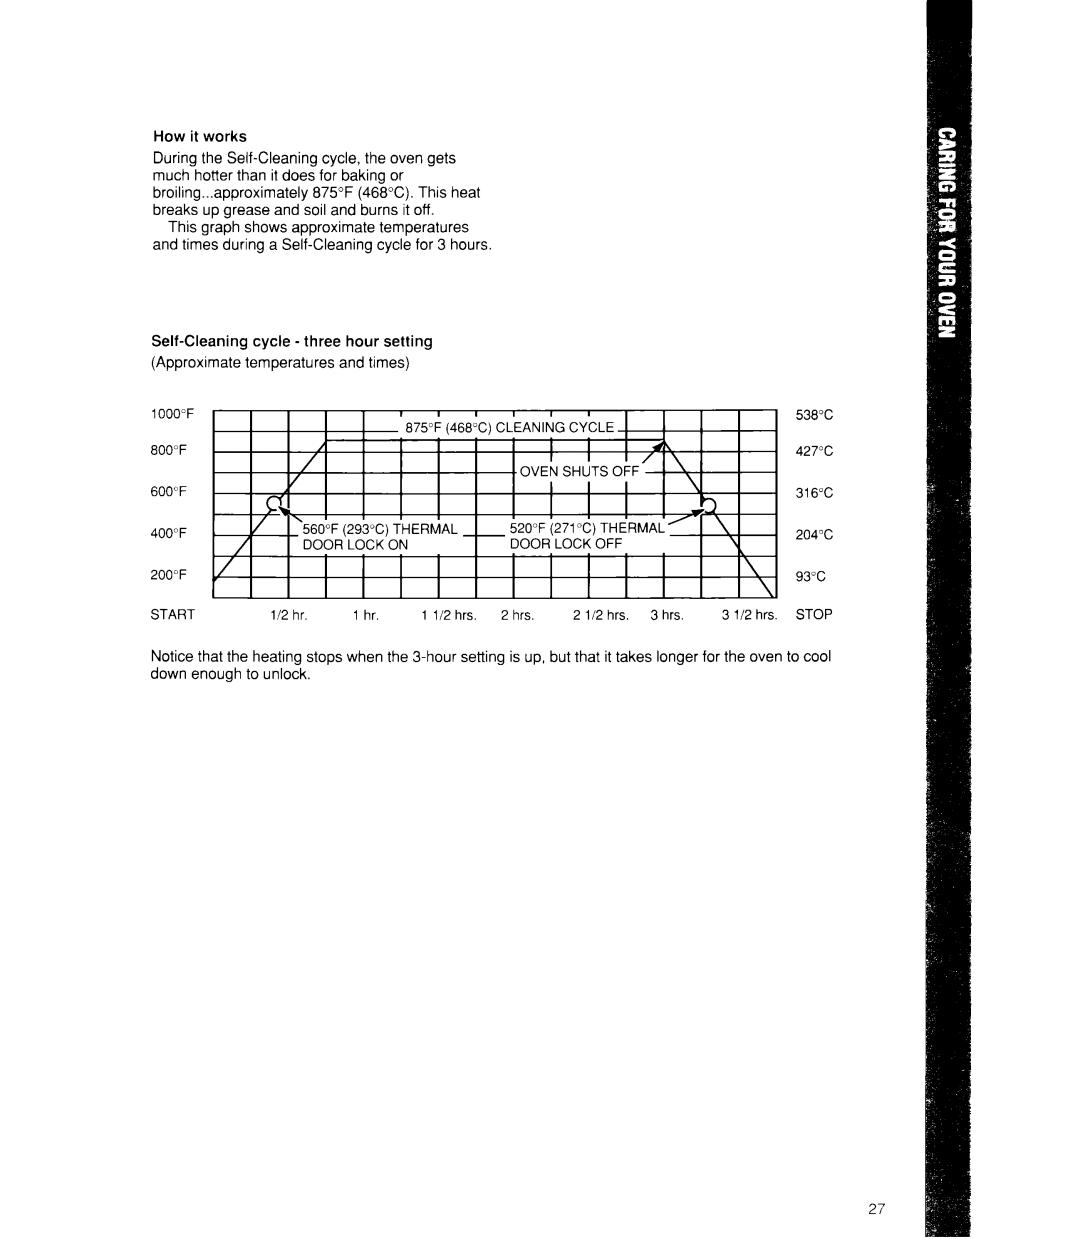
How it works
During the
This graph shows approximate temperatures and times during a
cycle |
| hour | setting |
|
|
|
| |
(Approximate | temperatures | and times) |
|
|
|
| ||
1000°F |
|
|
|
|
|
|
|
|
800°F |
|
|
|
|
|
|
| 427°C |
600°F |
|
|
|
|
|
|
| 316°C |
400°F |
|
|
|
|
|
|
| 204°C |
200°F |
|
|
|
|
|
|
|
|
START | l/2 | hr. | 1 hr. | 1 112 hrs. | 2 hrs. | 2 112 hrs. | 3 hrs. | 3 112 hrs. STOP |
Notice that the heating stops when the