Superstack II Switch Administration Console User Guide
3Com Corporation 5400 Bayfront Plaza Santa Clara, California
Contents
Remote Access Parameters
Administration Console Interface Parameters
Setting Up an IP Interface for Management
Online Help
Rebooting the System
Setting Passwords
About Setting Baselines
Setting Baselines
Setting lerAlarm Setting lerCutoff
Setting tmaxLowerBound
Setting the Aging Time
Starting Port Monitoring
10-7
Setting the Bridge Priority
10-8
10-9
13-3
Using Groups in Packet Filters Listing Groups
Opcodes A-1
Destination Address Filter A-9
Support from 3Com
Access by Modem
World Wide Web Site 3ComForum on CompuServe
Returning Products for Repair
Introduction
About this Guide
Familiarity with communications protocols that are used on
Interconnected LANs
Switch 2200. The parts of the guide are described in Table
How to Use
This Guide
This guide
Conventions
Documentation
Switch
Documents, contact your sales representative for assistance
Comments
Introduction
About Switch Administration
Administration Overview
Configuration Tasks
Adjust the console screen height for your terminal
General System Commands Task Quick Command For Details, See
Change the factory default baud rate of the Console port
To the system, or reset nonvolatile data to defaults
Bridging Commands Task Quick Command For Details, See
System Management Setup Commands Task Quick Command
Configurations, and spanning tree configurations
12-1 and following
Administer bridge port addresses
Display bridge port information
Set the multicast packet firewall threshold
A summarized or detailed format
Ethernet Commands Task Quick Command For Details, See
9-2 to
8-3
Fddi Commands Task Quick Command
Initial User Access
HOW to USE
Access
Levels of User
Select access level read, write, administer Password
Using Menus to Perform Tasks
System-level Functions Menu Hierarchy for Administer Access
Bridge Menu
Fddi Menu
IP Menu
Bridging Menu Hierarchy for Administer Access
Analyzer Menu
Snmp Menu
Menu options are not case sensitive
Most abbreviated version of the same command string is
Entering Values
Console Interface
Adjusting
Parameters
Disabling Reboot Abort Keys
System consoleLock
Setting Timeout Interval for Remote Sessions
Running Scripts Administration Console Tasks
Enter the telnet timeout interval 30 minutes to 60 minutes
HOW to USE the Administration Console
Running Scripts of Administration Console Tasks
Help
Getting
Console
To exit from the Administration Console
Exiting returns you to the password prompt
Exiting
There, by pressing the ESC key
SYSTEM-LEVEL Functions
Page
About
Access to the System
Management
Setting Up Console Serial Port
IP Interface for
Setting Up an
Broadcast Address
Cost Ports All
Directed all 1s in the host field
Broadcast address
Ip interface modify
Removing an Interface
Timing out
Gateway IP Address
Timed out
Defining a Static Route
Default route is immediately removed from the routing table
Administering the ARP Cache
Setting the RIP Mode
You could receive one of the following responses
Enter the IP address of the station you want to ping
IP statistics you can view are described in Table
Displaying IP Statistics
Statistics are displayed, as shown in this example
Displaying Snmp Settings
Setting Up Snmp on Your System
Community string settings are displayed as shown here
Community string length
Administering Snmp Trap Reporting
Enter an IP address of the Snmp manager destination address
Configuring Trap Reporting
Trap address invalid or unreachable
This example shows a trap configuration
You receive the following prompt
Remote SMT events. On all other Switch 2200s in your network
Snmp trap smtProxyTraps
Environment
Example of a Switch 2200 system configuration display
Displaying System Configuration
Initial passwords
Setting Passwords
Changing the Date and Time
Setting the System Name
You are prompted for the name of the system
Rebooting
You must disable the baseline
About Setting
Baselines
Displaying the Current Baseline
Baselining is automatically enabled when a baseline is set
Setting Baselines
Enabling or Disabling Baselines
Message similar to the following appears
Working with
SAVING, RESTORING, and Resetting Nonvolatile Data
Nonvolatile Data
Saving NV Data
NV Data
Restoring
Saving the NV data
Restoration rules described here
System nvData restore
You are returned to the NV data menu options
Examining a Saved NV Data File
You see the following prompt
Resetting NV Data to Defaults
Ethernet and Fddi Parameters
III
Page
Displaying
Ports
Ethernet Port
Information
RxDiscards
Describes the information provided about an Ethernet port
Layer to receive them or because the port was disabled
Default is enabled
Long and are not configurable
Disabled
Successfully
Second long and are not configurable
Transmitted successfully
TxPeakByteRate
There is no buffer space available Frame is in error
TxFrames Frames delivered to this port
TxDiscards TxQOverflows
Labeling a Port
Setting the Port State
Resources
Administering
Fddi Stations
Can be Thru, Isolated, WrapA, and WrapB
Describes these statistics
ConnectPolicy
This value can be user-defined
Description of Fields for Fddi Station Attributes TNotify
Defaults for connecting to a Port M
Frames NIF. This value can be user-defined
TraceMaxExp
Normal tree connection
With defaults for connecting to a Port M
Topology
Node may not go to Thru state in CFM
Enabling Disabling Status Reporting
Setting Neighbor Notification Timer
Fddi Paths
RingLatency
Description of Fields for Fddi Path Attributes MaxTReq
TmaxLowBound
TraceStatus Current Trace status of the path TvxLowBound
Station, which appears in brackets
To set tvxLowerBound
Fddi MACs
Displaying MAC Information
Administering Fddi MACs
Describes the information provided for the Fddi MAC
Description of Fields for Fddi MAC Attributes OldDownstream
Error during reception
Neighbor
OldUpstream
There is no buffer space available Frame is in error
Receive Frame Network
Shows the order in which the discard tests are made
Setting the Frame Error Threshold
Enter the new threshold value. See the following example
Setting the Not Copied Threshold
Setting MAC Paths
Enabling Disabling LLC Service
Displaying Port Information
Administering Fddi Ports
Describes the type of information provided for an Fddi port
Setting lerCutoff
Setting Port Labels
Fddi port path
About Roving
Roving Analysis
Analysis
On a specific system
Roving Analysis
Receive
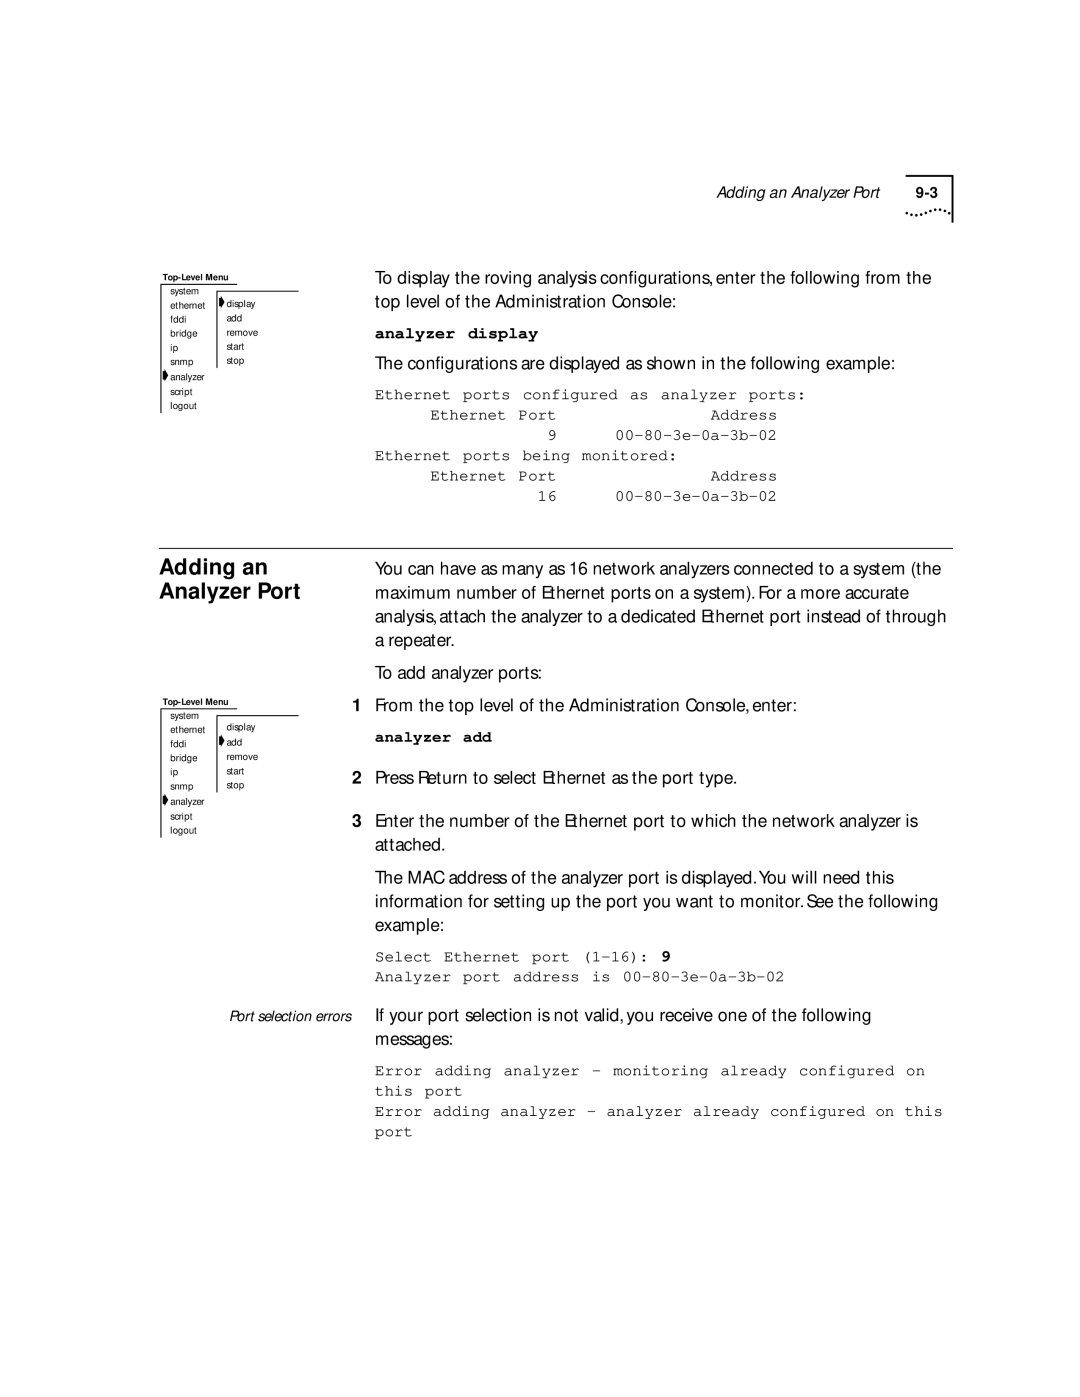
Adding an Analyzer Port
Removing an Analyzer Port
Monitoring
Starting Port
You can start monitoring port activity
See the example below for starting port monitoring
Stopping Port Monitoring
Bridging Parameters
Information about the bridge is displayed
Displaying Bridge Information
Each item in the bridge parameter list is described in Table
Following example shows a display of bridge information
Learning states. The default value is 15 seconds
BridgeFwdDelay
Root. The default value is 2 seconds
ForwardDelay
Bridge Attributes Parameter Description MaxAge
Default value is disabled
Is determined by the root bridge
Mode
Disabling IP
Enabling
Fragmentation
Disabling IPX
Address
Setting
Threshold
Aging Time
STP Bridge
Enter enabled or disabled at the prompt
Enabling and Disabling STP on a Bridge
To configure the STP bridge priority
Setting the Bridge Maximum Age
To configure the forward delay value
Forward delay The recommended value is 15 seconds
Setting the STP Group Address
Bridge Port
Following example shows a bridge port detail display
Following example shows a bridge port summary display
Port is attached
RxErrorDiscs
DesignatedCost
BPDUs from the designated bridge for that LAN
Management frames
Bridge Port Attributes Parameter Description RxFrames
RxMcastExcDiscs
Exceeded
Disabled The port has been disabled by management
Disabled in which the port is currently operating
Bridge Port Attributes Parameter Description State
Blocking The bridge continues to run the Spanning Tree
Shows the order in which the discard decisions are made
You are prompted for port type
Multicast Limit
Multicast packet firewall, see Bridging Extensions
Enabling
STP Bridge Port
Disabling STP
On a Port
Bridge port stpCost
Bridge port stpPriority
Listing Addresses
Administering Port Addresses
You are prompted for the port number
From the top level of the Administration Console, enter
Enter the number of the port
You are prompted for one or more addresses to add
Flushing All Addresses
You are prompted for the port numbers
Packet Filtering
Packet Filters
Listing Packet Filters
Displaying Packet Filters
Creating and Using Packet Filters
Describes the instructions and stacks of a packet filter
Ethernet and Fddi Packet Fields
Basic Elements of a Packet Filter
PushField
Packet Filter Operands Description Opcode Packet field
Size of the field can be 1, 2, 4, or 6 bytes
Want the filter to examine a 48-bit address Constant
Accept and Reject Instructions
Creating Packet Filters 12-9
Preprocessed and Run-time Storage
Opcode.size operand... # comment
12-11
Creating and Using Packet Filters
# XNS Filtering Section
Pseudocode translates into the following packet filter
Enter executable instruction #2
Enter executable instruction #1
Enter executable instruction #4
Enter executable instruction #3
Enter executable instruction #5
Enter executable instruction #6
Only IP pkts w/in socket range
This combination looks like this
Add a not statement to discard any matching packets
Maximum length of a packet filter definition is 4096 bytes
Being edited
Command are discarded
Delete Previous Ctrl+h
Character One position Delete Current Ctrl+d
Editing, Checking
Deleting Packet Filters
Saving
Packet Filters
At the Replace existing filter? prompt
Bridge packetFilter load
Loading Packet Filters
Fddi
Unassigning Packet Filters from Ports
Using Groups
Configuring Address Port Groups to USE Packet Filters
User-defined Packet Filtering in the SuperStack II Switch
Address and port groups in packet filters
To list the currently defined groups, enter this command
OR, for port groups, enter the following command
Displaying Groups
Enter this command
Creating New Groups
Address 08-32-45-e3-32-21
Enter the ports in this syntax
Port Ethernet
Addresses
Adding
Ports to Groups
Address 08-37-21-65-78-c4
To remove an address from a group, enter
Removing Addresses or Ports from a Group
OR, to remove a port from a group, enter
Enter the ports in the syntax
Address 08-42-21-84-78-f1
Loading Groups 13-11
Configuring Address and Port Groups to USE in Packet Filters
Appendixes
Opcodes
Packet Filter Opcodes
Opcodes are described in this section
Name name
Bytes PushLiteral.size value
PushField.size offset
Byte PushSAGM
PushTop
Byte PushDAGM
Byte
Byte PushDPGM
PushSPGM
Byte Eq equal
Byte Lt less than
Ne not equal
Byte Le less than or equal to
Byte Ge greater than or equal to
Gt greater than
Byte Bit-wise
Byte Xor bit-wise exclusive-OR
Or bit-wise or
Byte Not
Byte Accept
Byte Shiftl shift left
Reject
Byte Shiftr shift right
Examples
Packet Filter
Packet filter concepts
Address
XNS
To make a copy of the type field
Page
Common Syntax
Errors
Number with a leading 0x or 0X is treated as
Characters of the number
Hexadecimal
Number with a leading 0 is treated as octal
Variety of services. This appendix describes these services
Services
Online Technical
Through the following online systems
Press Return to see the 3ComForum main menu
Access by Isdn
Support from
Maintenance, application training, and support services
Your Network
Supplier
To find your authorized service provider
U.S. and Canada, call 800 876-3266 for customer service
3Com
Support contracts are available from 3Com
Index
Address Resolution Protocol. See ARP address threshold
3ComFacts B-3 3ComForum B-2 Abort
ARP cache flushing 3-12 removing entry
Statistics, displaying 10-1bridge port
Multicast limit, setting 11-7 Spanning Tree Enabling
Cost
PortState Station MAC addresses 11-11Ethernet address
SRFs 8-2 Connection policies, setting
Fddi path defined
Fddi port
Enabling Le opcode A-5
Removing from -9, 3-10 status
On-line technical services B-1opcode
Name opcode A-1 Naming the Switch 2200 4-3ne opcode A-5
Password configuring
Multicast frames Packet filters 12-1multicast limit
Rlogin
Broadcast address 3-4default mode 3-12displaying state
Fddi ports 8-19ping IP station
SMT event
Snmp agent Accessing through IP 3-1defined Snmp trap
Sniffing. See roving analysis and analyzer
Port LER Condition Port Path Change
Defined 8-7 setting
Switch
TOpr Technical support B-1telnet
Packet filter 12-12, 12-14, A-11 xor opcode A-7