CP9185 CP9190 Elite AutoScanner Elite AutoScanner Pro
HW Ver Boot Ver Prod ID Board ID Burn Date Burn Loc
Serial No
Technical Support
Table of Contents
Global OBD II Diagnostics
Import Diagnostics
Appendix C Glossary
Safety Precautions
Type Styles Used
Icons used
Important Safety Messages
Avoid sparks when connecting or disconnecting
Battery terminals. Do not place uninsulated metal
Tools on the battery
Power leads to the battery
Do not touch eyes while working near battery
Have plenty of fresh water and soap nearby
Risk of fire
Short circuits can cause injury
Engine compartment contains electrical connections
Unless instructed otherwise
Do not leave a running engine unattended
An air bag opening can cause injury
Equipment Tips and Lists
Safety Messages
Check Note
Equipment Damage
Questions and Responses
Functions and Selections
Menus
Manual References
Getting Started
Introduction
Using the CD
Installing Applications On Included CD
Close all programs on the computer Place the CD in CD-Drive
European Vehicles
Vehicle Service Information
Domestic Vehicles Web Site
Asian Vehicles Web Site
Other Manuals
Repair Information Programs
Suitable Manual Titles
Introduction to On-Board Diagnostics
OBD
GM On-Board Diagnostics
SAE Publications
Ford On-Board Diagnostics
Data Link Connector DLC
OBD II J1962
Data Link Connector DLC Pins
Ford Historic
Mecs
Cable Adapter Vehicle DLC
Vehicle DLC
GM Historic
Use the cigarette lighter cable to provide 12V to the tool
Chrysler Historic
OBD II Diagnostic Trouble Codes DTCs
1 0
Lower Upper Assigned DTC System
Using The Scan Tool
Scan Tool
Internal Power 9V Battery External Power 7 to 16 Volts
Specifications
Operating Temperature 0 to 50C 32 to 122F
Power Dissipation 5 Watts maximum Dimensions Height
Accessories for the Scan Tool
Part Part Description CP9185 CP9190
Display
Keypad
Power
Internal Battery
Vehicle Power
Scan Tool Power UP
System Setup
System Setup allows
From System Setup screen Select English/Metric
From Main Menu 1.Select System Setup
Use UP or Down arrow key until System Setup is highlighted
Changing Measurement Units
Save Measurement Setting. Press Enter
From System Setup screen Select Contrast Adjust
Changing Display Contrast
From System Setup menu
Save Contrast Setting
Setup menu
Beeper
Changing Auto-Power Off
System Setup menu
From System Setup menu Select Auto Power Off
Increase or Decrease Auto Power Off Time
Save Auto Power Off Time. Press Enter
View Tool Information
From System Setup menu Select Display Test
Display Test
When Done, Press Back Key
Start Display Test
Look for Missing Spots
Memory Test
From System Setup menu Select Keyboard Test
Keyboard Test
Use UP or Down arrow key until Keyboard Test is highlighted
From System Setup menu Select Memory Test
Return to System Setup menu. Press Enter
2-9 of Getting Started
Connecting The Scan Tool
Program Mode
Connect appropriate cable to Scan Tool
Review Data
Select Review Data
Playback
Follow prompts and instructions provided by Scan Tool
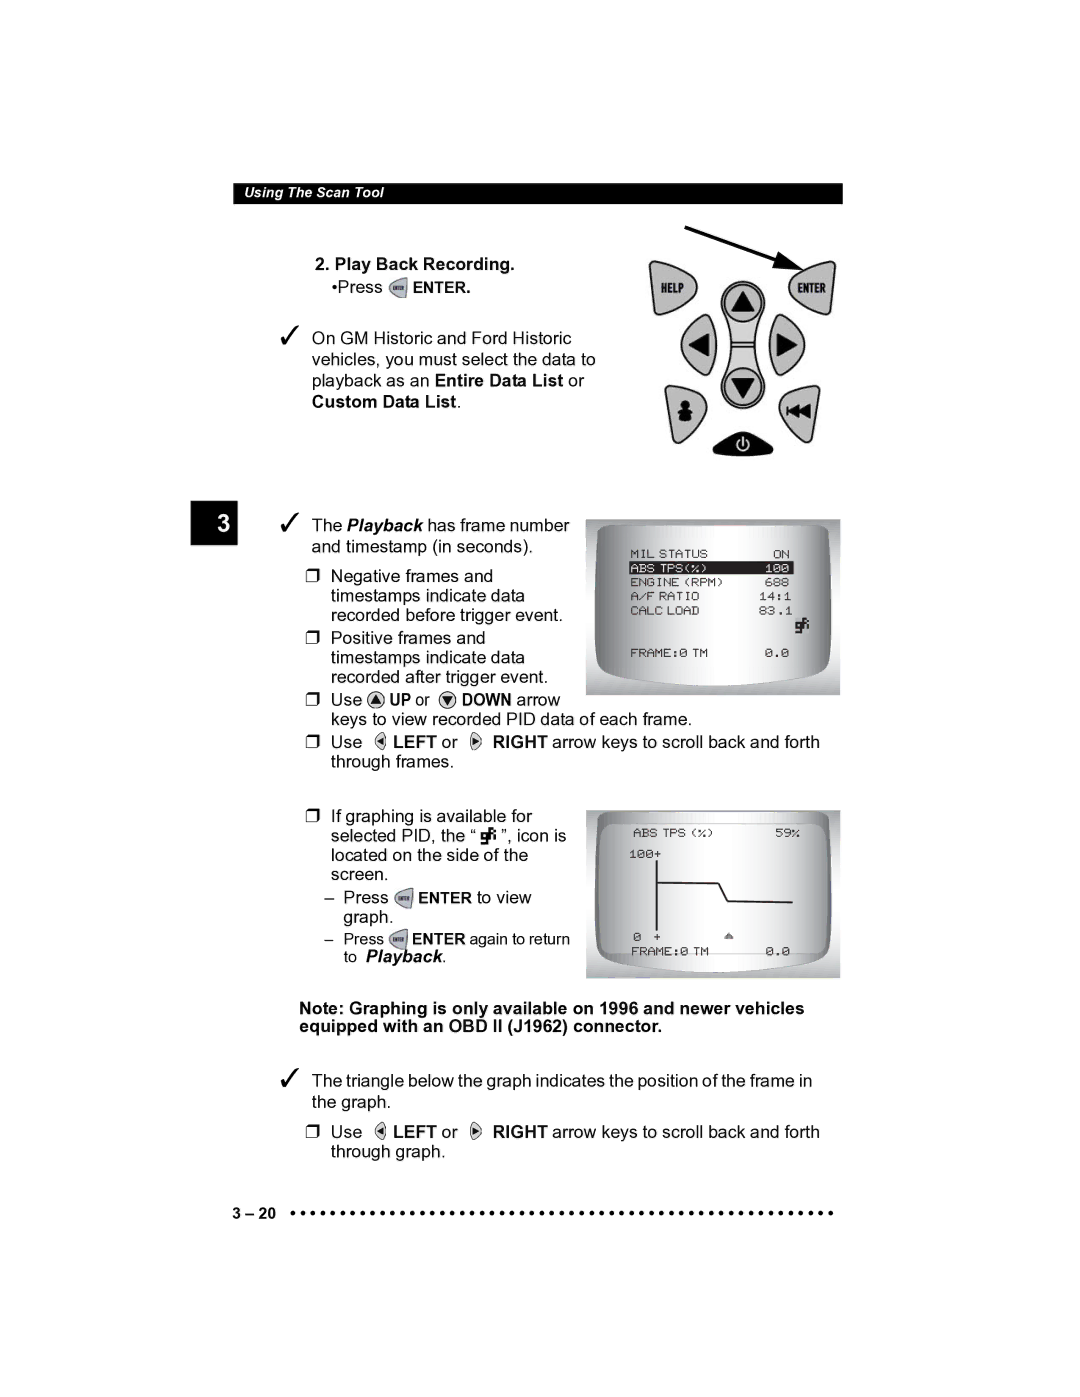
Play Back Recording. Press Enter
Print Data
Return to Review Data menu. Press Back
From Special Tests menu Select Print Data
Use UP or Down arrow key until Print Data is highlighted
Select Data To Be Printed. Use UP or Down arrow key
Select Code Lookup
Code Lookup
Return to Select Print Data screen. Press Enter
Use UP or Down arrow key until Code Lookup is highlighted
P0001
Enter code
P1575
Select Setup User Key
Setup User Key
From Tool Setup Menu
Key until Setup User Key is
Vehicle Selection
From Main Menu
Confirm selection
Follow Instructions on the display
Using The Scan Tool
Global OBD II Diagnostics
Datastream Menu
Global Function List
Global Function List is
Special Tests Menu
Code Lookup Tool Setup Menu
Datastream Menu
Select View Data
View Data
From Datastream Menu
Observe while Scan Tool validates PID MAP
View Entire List
From Select Data to View menu Select Entire Data List
View PIDs on Scan Tool Use UP or Down arrow key
Menu
Return to PID Screen
Return to Select Data to View
Return to Datastream Menu
Select View Instructions or Not Use Left or Right arrow key
Select PIDs to View
From Select Data to View menu Select Customize Lines
Return to Select Data to View Menu
Customize Lines
Key until Customize Lines is
Record Data
Select Display Lines
Refer to View Data to setup Custom List or View Entire List
From Datastream Menu Select Record Data
Use UP or Down arrow key until Record Data is highlighted
From the Pick Trigger Method Screen
Diagnostic Codes Menu
Diagnostic Codes Menu
Read Codes
From Diagnostic Codes Menu Select Read Codes
Use UP or Down arrow key until Read Codes is highlighted
View and write down DTCs. Use UP or Down arrow key
Return to Diagnostic Codes Menu
Pending Codes
From the Diagnostic Codes Menu Select Pending Codes
Use UP or Down arrow key until Pending Codes is highlighted
If Pending Codes are Present
From Diagnostic Codes Menu Select Erase Codes
Erase Codes
Use UP or Down arrow key until Erase Codes is highlighted
Select Yes to erase diagnostic results and codes
Prepare Vehicle. Turn key on. Leave engine off. Press Enter
From the Diagnostic Codes Menu
Observe Command Sent message is displayed
Return to Diagnostic Codes Menu. Press Enter
View Freeze Data
Special Tests Menu
Select another frame to view if available
Readiness
This Drive Cycle. If vehicle
From the Special Tests Menu Select I/M Readiness
Use UP or Down arrow key until I/M Readiness is highlighted
I/M Readiness Menu
Abbreviated Name Expanded Name
Return to Special Tests Menu. Press Back
Drive Cycle Monitor
Clear Monitors by
From the Special Tests Menu Select Drive Cycle Monitor
Return to Special Tests Menu
State OBD Check
O2 Monitor Test
From the Special Tests Menu Select State OBD Check
Key until State OBD Check is
Following O2 Sensor Tests are available
From the Special Tests Menu Select O2 Monitor Test
Select O2 Sensor
Diagnostic Monitor Tests
From the Special Tests Menu Select Diag Mon Tests
Non-CAN Vehicles
Can Vehicles
On Non-CAN vehicles the Scan Tool displays
Return to Select Test Menu
On-Board Systems
From the Special Tests Menu
Select Test
Vehicle Info
Select Vehicle Info
Use UP or Down arrow key until Vehicle Info is highlighted
VIN
Return to Special Tests Menu Press Back or Enter key
Modules Present
Select Modules Present
ISO 15765-4 protocol is shown as can
ISO 14230-4 protocol is shown as K2K Keyword
Global OBD II Diagnostics
GM Function List
GM Function List is broken down into the following menus
Review Data Print Data Read Codes Playback
Use UP or Down arrow key until View Data is highlighted
Never operate the Scan Tool while driving. Have
From the Datastream Menu 1.Select View Data
Multiple Group Vehicles
From the Datastream Menu 1.Select Record Data
View PIDs on Scan Tool
Change Custom Data List Parameters
Use UP or Down arrow key until Record Data is highlight
Select Trigger Method
Recording. Trigger on Codes will
Review Data Return to Datastream Menu
From the Diagnostic Codes Menu Select Read Codes
View and write down DTCs Use UP or Down arrow keys
From the Diagnostic Codes Menu Select Erase Codes
Manual Erase Methods
Use UP or Down arrow key until Field Service is highlighted
Field Service
From the Special Tests Menu Select Field Service
Check vehicle malfunction indicator lamp MIL
Koeo Procedure
Code 12 will look like
Code 23 will look like
Koer Procedure
GM Enhanced OBD II Diagnostics
Code Lookup Tool Setup menu
Diagnostic Codes Menu
Return to Diagnostic Codes Menu. Press Back
View and write down the DTCs
FromtheDiagnosticCodesMenu Select Erase Codes
Ford Function List
Ford Function List is
On Demand Test Menu
With Mazda-sourced engines use the Mazda Electronic Control
View Data
From the Datastream Menu Select View Data
Return to Datastream Menu. Press Back
Record Data
Select data to view
From the Datastream Menu Select Record Data
Ready to Record
Diagnostic Codes Menu
Select Fast Codes or Slow Codes
From the Diagnostic Codes Menu Select Read Koeo Codes
Read Koeo Codes
Use UP or Down arrow key until selection is highlighted
When the test is complete
Avoid cooling fan! It may turn on during test
Read Koer Codes
View and write down DTCs
Select Fast Codes, Slow Codes or Computed Timing
Select Read Koer Codes
Key until Read Koer Codes is
Key until desired chioce is
When test completed. Turn ignition key off
326
Computed Timing Check 1984-1991 EEC-IV Vehicles
From the Select Code Type menu Select Computed Timing
Erase Codes
EEC-IV Erase Codes
Erase Memory Codes
Return to the Diagnostic Codes Menu
Perform the following 1 Turn ignition key off
Mecs Erase Codes
Follow all instructions on the display
Keys until Ivsc Speed Ctrl is
From the Diagnostic Codes Menu Elect Ivsc Speed Ctrl
IVSC-Speed Ctrl EEC-IV Vehicles
Keys until Read Koeo Codes
568
Reading Ivsc Koer Codes
Keys until Read Koer Codes
Perform the following
On Demand Test Menu
Wiggle Test EEC-IV Vehicles
From the On Demand Test Menu Select Wiggle Test
After making a selection
Wiggle Test instructions
Start KOEO/KOER Wiggle Test. Press Enter
Return to On Demand Test
Output Switch Test EEC-IV Vehicles
From the On Demand Test Menu Select Output Sw Test
Keys until Output Sw Test is
Perform the following 1 Set parking brake
Toggle relays and solenoids
Return to On Demand Test Menu
Cylinder Cyl Balance Test EEC-IV Vehicles
From the On Demand Test Menu Select Cyl Balance Test
Wait for the Cylinder ID. Follow all user prompts
Start Cyl Balance Test
View test results
Return to On Demand Test Menu. Press Back
Star Test Mode EEC-IV, Mecs and MCU Vehicles
From the On Demand Test Menu Select Star Test Mode
Return to the On Demand Test Menu. Press Back
Three-Digit DTC 214 will Flash as follows
Ford Enhanced OBD II Diagnostics
Ford Function List is broken down into the following menus
Review Data Print Data
Read Codes
From the Diagnostic Codes Menu Select Read Codes
P1501
Ford Diagnostics
Chrysler Diagnostics
Chrysler Function List
Device Controls Menu
Troubleshooting
Datastream Menu
View PIDs on Scan Tool Use UP or Down arrow keys
Next, turn the ignition key on. Engine can be off or running
Use UP or Down arrow key until Sensor Test is highlighted
Sensor Test
From the Datastream Menu Select Sensor Test
Turn ignition key on Engine can be off or running
Select Read Codes
Keep hands and tools away from fan and engine during test
P0406
Follow the instructions. Press Enter
Switch Test
Device Controls Menu
From the Device Controls Menu Select Actuator Test
Operate selected switch
Actuator Test
Use UP or Down arrow key until Actuator Test is highlighted
To test another actuator. Press Back
Return to the Device Controls Menu
During test
Idle Speed Test
From the Device Controls Menu Select Idle Speed Test
Return to the Device Controls Menu. Press Back
Import Function List
Import Function List is broken down into the following menus
Exists, refer to Error Messages on
Read Codes
Press Back key
How to Use On-Line Help
To Use On-Line Help Press Help Key
Return to original screen
Error Messages
Scan Tool Does Not Power Up
Check the following if an error message displays
Vehicle Communication Fault
Turn vehicle key to off position
Operating Error or Erroneous Data
Remove Battery and Properly Discard Install New Battery
Battery Replacement
Remove Battery Cover
Reinstall Battery Cover
Tool Self-Tests
Technical Support
Appendix a PID Definitions
CLR TIM 0 65,535 min or 0 1092.25 hours
Outsid AIR 40 215ºC or 40 419ºF
Troub Code 0000 Ffff
PID List
2ND Trip FT
Desired
AIR Pump
Baro
Calc ECT
CCP Solenoid
Cruise
CYL 4 Misfire
ECU RST-CLK L
ENG TOR
Evap VP
Fault 3 KEY-ON
FS/LR SOL
Fuel SYS1
HI SPK Mode
IAT Temp C/F
INJ Fault
Knock RET
LO Coolant LMP
Ltst DTC Pend
MIS CYL P
State
O2 Sensorv
O2S Bias
ODM1 Ovrtemp
Pres Torq
REV Inhibit
SET Sync Mode
Spkadv CYL4
TCC Command
THR POS C
TR Switch C
VEH Speed
Appendix B Data Link Connectors
GM Cars, Light Trucks & Vans
Series
Ford, Lincoln & Mercury Cars, Light Trucks & Vans
Ford, Lincoln & Mercury Cars, Light Trucks & Vans
SHP
GVW
Chrysler Cars, Light Trucks & Vans
Chrysler Cars, Light Trucks & Vans
Smec
Data Link Connectors
Pressure Sensor
Pressure Switch
Clutch Relay
Actuator
Catalytic Converter
Brake Switch Signal
Boost Control Solenoid
Closed Loop CL
Detonation
Data Link Connector DLC
Data Stream
Duty Cycle
Freeze Frame
Ground GND
Hall Effect Sensor
Knock Sensor KS
Knock
Mpfi or MFI
Misfire
Monitor
NOx
Relay
Pending Codes
Purge Solenoid
Reluctance Sensor
SFI or Sefi
Scan Tool
Sensor
Solenoid
Throttle Body
Traction Assist
Trip
Warm-up Cycle
WOT
Technical Service
Repair
Glossary
Glossary
SPX Corporation All Rights Reserved