E4440A specifications
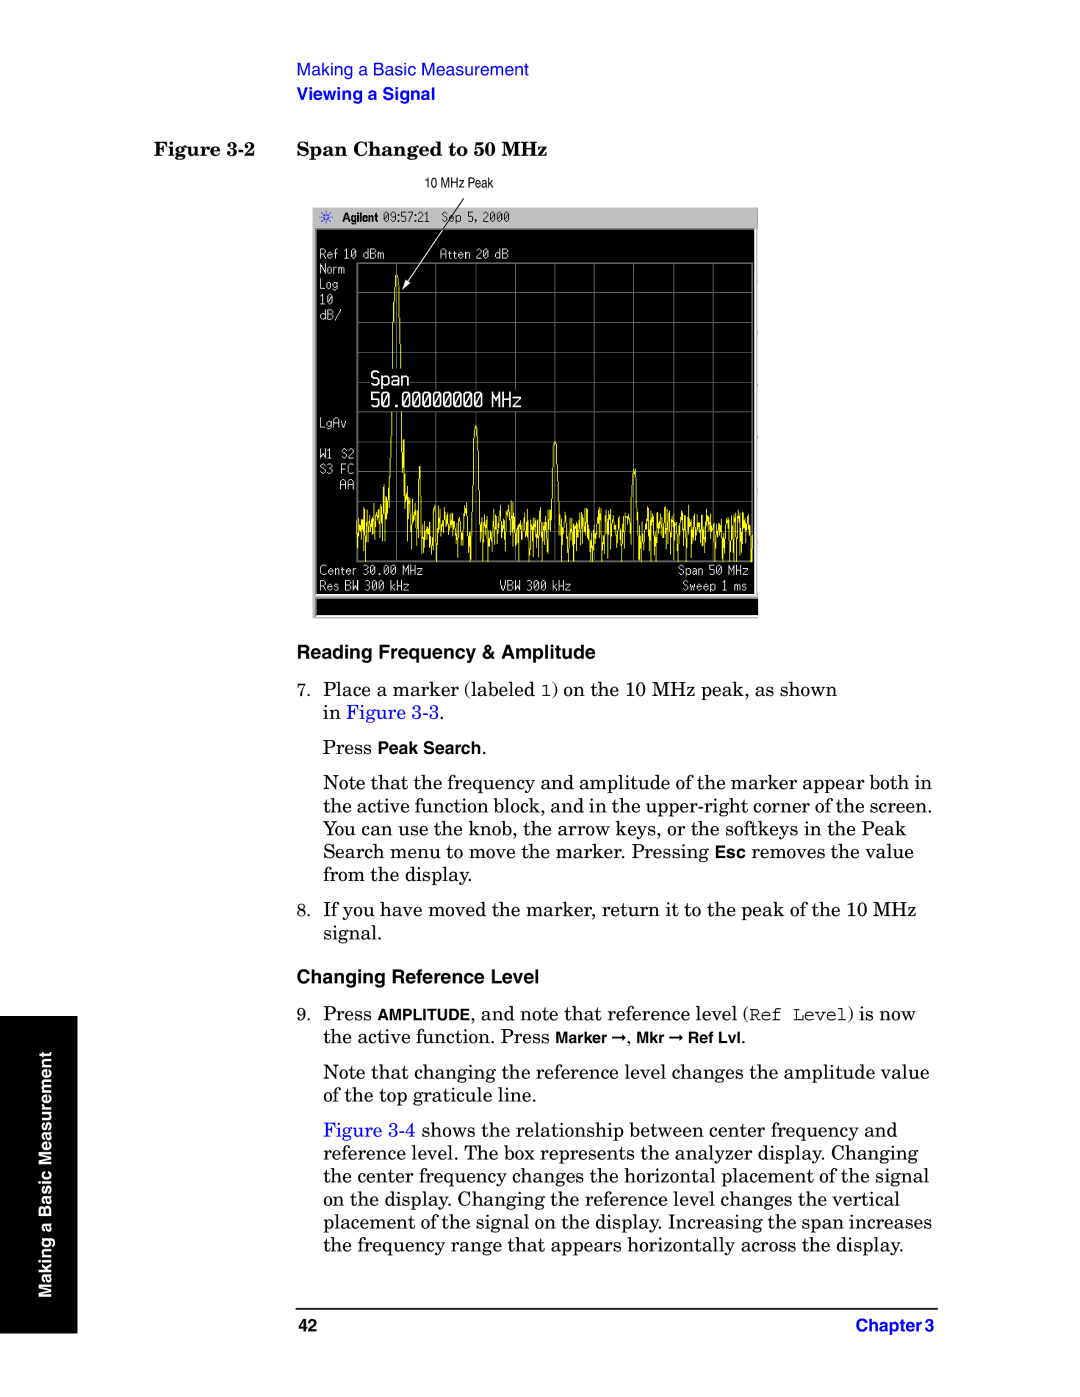
Agilent Technologies has long been recognized for its cutting-edge solutions in the realm of electronic test and measurement, and the E4440A is no exception. This spectrum analyzer is part of Agilent's renowned X-Series, which has set benchmarks in performance and versatility for RF and microwave applications. The E4440A stands out for its reliability, accuracy, and advanced signal analysis capabilities.One of the most notable features of the E4440A is its exceptional frequency range. The device covers frequencies from 3 Hz to 9 kHz, allowing it to handle a wide array of signals, from low-frequency communications to high-frequency RF applications. By offering such broad bandwidth, the E4440A caters to various sectors including telecommunications, aerospace, and research and development.
In terms of specifications, the E4440A boasts a maximum amplitude measurement accuracy of ±0.7 dB, which is crucial for detailed signal analysis. Its 1 Hz to 30 MHz demodulation bandwidth allows users to accurately analyze complex modulated signals, making it ideal for capturing and decoding various communication formats.
Built on Agilent's exclusive technology, the E4440A integrates the advanced "Digital Signal Processing" capabilities, enhancing its measurement precision and speed. This technology not only improves the analyzer's dynamic range but also allows for quick identification and analysis of signals, ensuring that engineers can optimize performance and troubleshoot issues more effectively.
A unique characteristic of the E4440A is its robust user interface. The spectrum analyzer features a high-resolution display, which provides clear visualizations of signals. Additionally, its intuitive navigation simplifies operation, enabling both seasoned engineers and newcomers to utilize the device effectively without extensive training.
The E4440A is also equipped with a variety of built-in measurement capabilities, including distortion, modulation, and phase noise analysis. These tools empower users to assess the quality of their transmission systems comprehensively, thus facilitating improvements and innovations in design.
In conclusion, Agilent Technologies E4440A stands as a versatile spectrum analyzer that combines cutting-edge technology with user-friendly features. Its broad frequency range, high accuracy, and advanced analysis capabilities make it an essential tool for professionals in the RF and microwave sectors. Whether for research, development, or testing, the E4440A delivers the precision and reliability that engineers expect from Agilent Technologies.

