Viewing Statistics
Viewing Statistics
Statistics for an AsantéHub
Table Statistics
1 Select a port or group for which statistics are to be gathered by clicking on it once. To view statistics for the device, do not select any item on the
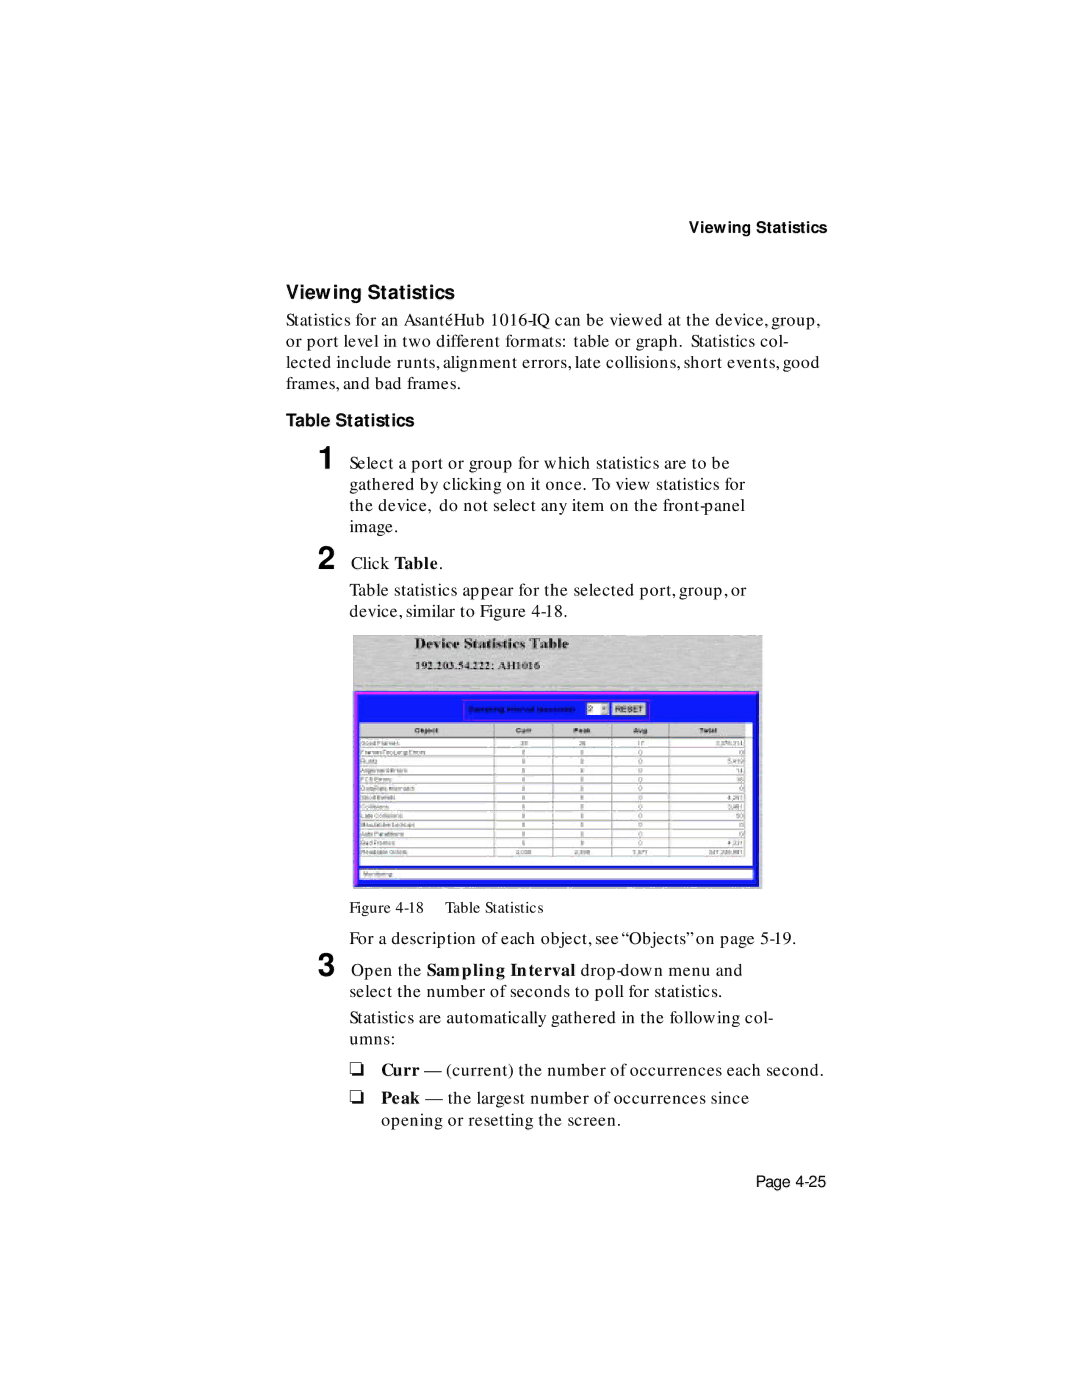
2 Click Table.
Table statistics appear for the selected port, group, or device, similar to Figure
Figure 4-18 Table Statistics
For a description of each object, see “Objects” on page
3 Open the Sampling Interval
Statistics are automatically gathered in the following col- umns:
❏Curr — (current) the number of occurrences each second.
❏Peak — the largest number of occurrences since opening or resetting the screen.
Page