Working with the Trend Screen

Overview - Log Interval

The AGM300 retains a data log of 100 measurements for each zone. The log interval is the number of minutes from 1 to 1440 between each log point. This parameter can be changed from the Zone Setup #1 Screen (Page 41).

The default setting for this parameter is 1440 minutes (24 hours). If the log interval time is set to 0, then a measurement is recorded in the trend log after every measurement cycle. Therefore, after the trend log is filled it will contain the last 100 measurement points for a zone. If you want the data logged less frequently you should increase this value. It is important to remember that cycle time is dependent on many factors, including the number of zones being monitored, input line length, and the run zeroing mode selected. Before changing this value it may be useful to first review the log data using the Trend Screen to determine the nominal cycle time.

Navigating To the Trend Screen

Access the Trend Screen from either the System Screen or Zone Screen as follows:

From the System Screen (Page 31) press the key adjacent to the AGM300 unit associated with the zone you wish to work with to display that monitor's AGM Setup Screen #1. Next, press the ZONES key to go to Zone Setup Screen #1, and then press the TREND key at the bottom of the display to go to the Trend Screen.

From the top level Zone Screen (Page 44) press the key adjacent to the zone you wish to work with to first display its Zone Setup Screen #1. Then press the TREND key at the bottom of the display to go to the Trend Screen.

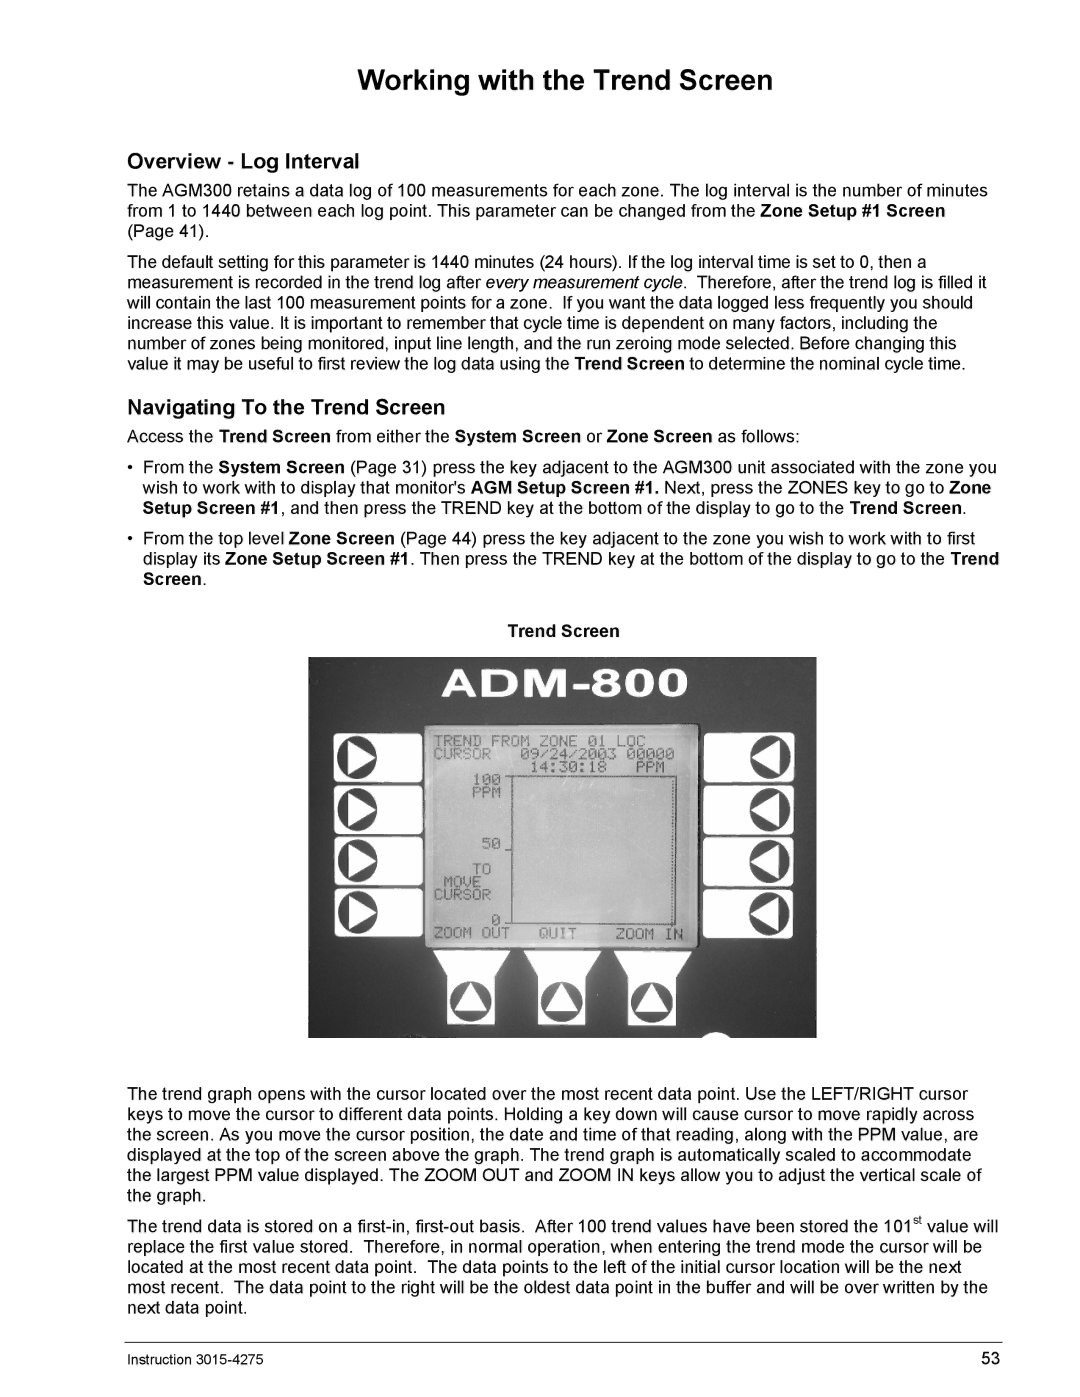
Trend Screen

The trend graph opens with the cursor located over the most recent data point. Use the LEFT/RIGHT cursor keys to move the cursor to different data points. Holding a key down will cause cursor to move rapidly across the screen. As you move the cursor position, the date and time of that reading, along with the PPM value, are displayed at the top of the screen above the graph. The trend graph is automatically scaled to accommodate the largest PPM value displayed. The ZOOM OUT and ZOOM IN keys allow you to adjust the vertical scale of the graph.

The trend data is stored on a first-in, first-out basis. After 100 trend values have been stored the 101st value will replace the first value stored. Therefore, in normal operation, when entering the trend mode the cursor will be located at the most recent data point. The data points to the left of the initial cursor location will be the next most recent. The data point to the right will be the oldest data point in the buffer and will be over written by the next data point.

Instruction 3015-4275

53

Page 61
Image 61
Bacharach AGM300, ADM800 manual Working with the Trend Screen, Overview Log Interval, Navigating To the Trend Screen

AGM300, ADM800 specifications

The Bacharach ADM 800 and AGM 300 are advanced analyzers designed for efficient monitoring and detection of gases in various applications. Known for their reliability and accuracy, these instruments cater to commercial and industrial sectors, ensuring safety and compliance with environmental regulations.

The Bacharach ADM 800 is a portable gas detection device renowned for its ability to detect multiple refrigerants. With a user-friendly interface, it features a high-resolution display that provides real-time data on refrigerant concentrations, allowing technicians to quickly identify leaks during maintenance operations. One of its standout technologies is a highly sensitive thermal conductivity sensor, which enables the ADM 800 to differentiate between various hydrocarbon refrigerants with precision.

Equipped with data logging capabilities, the ADM 800 can store and retrieve measurement data, making it an invaluable tool for tracking refrigerant trends over time. The device supports USB connectivity for easy transfer of data to computers, facilitating detailed reporting and analysis. Its robust design incorporates a protective casing that ensures durability in challenging work environments, making it ideal for both field use and stationary applications.

On the other hand, the Bacharach AGM 300 is specifically crafted for continuous gas monitoring in HVAC systems. This stationary device excels in measuring concentrations of gases such as CO, CO2, and various refrigerants, ensuring optimal performance and compliance. The AGM 300 uses advanced electrochemical sensors for precise gas measurements, providing real-time feedback and alerting users to any hazardous conditions.

One of the notable features of the AGM 300 is its ability to integrate seamlessly with building management systems, enabling centralized control and monitoring of gas levels across multiple locations. This connectivity enhances the safety of industrial and commercial spaces by allowing for automated responses to detected gas levels, which can significantly mitigate risks associated with gas leaks.

Both models emphasize user-centric design, with intuitive interfaces and clear displays, making them accessible even to those with minimal training. Additionally, their low maintenance requirements and long sensor life contribute to reduced operational costs.

In conclusion, the Bacharach ADM 800 and AGM 300 are exemplary solutions for gas detection and monitoring. Their advanced technologies, robust features, and user-friendly designs make them indispensable for ensuring safety and regulatory compliance in various environments.