Aerobic power measurement (1)
1 Select the Aerobic Power
Measurement Program
• For program selection see the Starting up section page 18. |
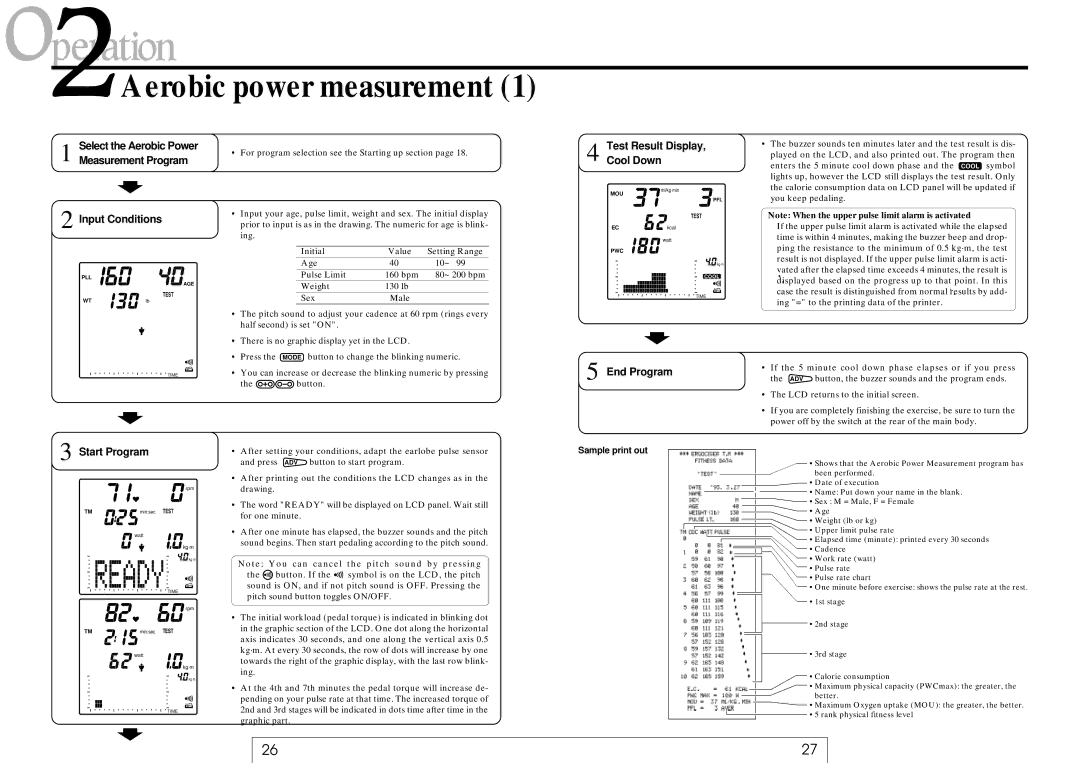
Test Result Display, | • The buzzer sounds ten minutes later and the test result is dis- | |
4 Cool Down | played on the LCD, and also printed out. The program then | |
enters the 5 minute cool down phase and the COOL symbol | ||
| ||
| lights up, however the LCD still displays the test result. Only | |
ml/kg·min | the calorie consumption data on LCD panel will be updated if | |
MOU | you keep pedaling. | |
PFL |
2 Input Conditions
PLL
AGE
TEST
WT![]() lb
lb
TIME
• Input your age, pulse limit, weight and sex. The initial display |
prior to input is as in the drawing. The numeric for age is blink- |
ing. |
Initial | Value | Setting Range |
Age | 40 | 10~ 99 |
Pulse Limit | 160 bpm | 80~ 200 bpm |
Weight | 130 lb |
|
Sex | Male |
|
• The pitch sound to adjust your cadence at 60 rpm (rings every | ||||||
half second) is set "ON". | ||||||
• There is no graphic display yet in the LCD. | ||||||
• Press the | MODE button to change the blinking numeric. | |||||
• You can increase or decrease the blinking numeric by pressing | ||||||
the |
|
|
|
|
| button. |
|
|
|
|
| ||
TEST
ECkcal
![]()
![]()
![]()
![]()
![]() watt
watt
PWC
![]()
![]() kg·m
kg·m
COOL
TIME
5 End Program
Note: When the upper pulse limit alarm is activated
If the upper pulse limit alarm is activated while the elapsed time is within 4 minutes, making the buzzer beep and drop- ping the resistance to the minimum of 0.5 kg·m, the test result is not displayed. If the upper pulse limit alarm is acti- vated after the elapsed time exceeds 4 minutes, the result is
•
displayed• based on the progress up to that. point. In this
case the result is distinguished from normal results. by add- ing "=" to the printing data of the printer.
•If the 5 minute cool down phase elapses or if you press the ADV button, the buzzer sounds and the program ends.
•The LCD returns to the initial screen.
•If you are completely finishing the exercise, be sure to turn the power off by the switch at the rear of the main body.
3 Start Program
|
|
|
|
|
|
|
| rpm | ||
TM |
|
|
|
|
| min:sec | TEST | |||
|
|
|
|
| watt |
|
|
| ||
|
|
|
|
|
|
|
| kg·m | ||
|
|
|
|
|
|
|
|
| kg·m | |
|
|
|
|
|
|
|
|
|
|
|
|
|
|
|
|
|
|
|
|
|
|
|
|
|
|
|
|
|
|
|
|
|
|
|
|
|
|
|
|
|
|
|
|
|
|
|
|
|
|
|
|
|
|
|
|
|
|
|
|
|
|
| TIME | ||
|
|
|
|
|
|
|
| rpm | ||
TM |
|
|
|
|
| min:sec | TEST | |||
|
|
|
|
| watt |
|
|
| ||
|
|
|
|
|
|
|
| kg·m | ||
|
|
|
|
|
|
|
|
| kg·m | |
TIME
• After setting your conditions, adapt the earlobe pulse sensor |
and press ADV button to start program. |
• After printing out the conditions the LCD changes as in the |
drawing. |
• The word "READY" will be displayed on LCD panel. Wait still |
for one minute. |
• After one minute has elapsed, the buzzer sounds and the pitch |
sound begins. Then start pedaling according to the pitch sound. |
Note: You can cancel the pitch sound by pressing
the ![]() button. If the
button. If the ![]()
![]()
![]() symbol is on the LCD, the pitch sound is ON, and if not pitch sound is OFF. Pressing the pitch sound button toggles ON/OFF.
symbol is on the LCD, the pitch sound is ON, and if not pitch sound is OFF. Pressing the pitch sound button toggles ON/OFF.
•The initial workload (pedal torque) is indicated in blinking dot in the graphic section of the LCD. One dot along the horizontal axis indicates 30 seconds, and one along the vertical axis 0.5 kg·m. At every 30 seconds, the row of dots will increase by one towards the right of the graphic display, with the last row blink- ing.
•At the 4th and 7th minutes the pedal torque will increase de- pending on your pulse rate at that time. The increased torque of 2nd and 3rd stages will be indicated in dots time after time in the graphic part.
Sample print out
• Shows that the Aerobic Power Measurement program has been performed.
• Date of execution
![]() • Name: Put down your name in the blank.
• Name: Put down your name in the blank.
• Sex : M = Male, F = Female
• Age
• Weight (lb or kg)
• Upper limit pulse rate
• Elapsed time (minute): printed every 30 seconds
• Cadence
• Work rate (watt)
• Pulse rate
• Pulse rate chart
• One minute before exercise: shows the pulse rate at the rest.
• 1st stage
• 2nd stage
• 3rd stage
• Calorie consumption
• Maximum physical capacity (PWCmax): the greater, the better.
• Maximum Oxygen uptake (MOU): the greater, the better.
![]()
![]() • 5 rank physical fitness level
• 5 rank physical fitness level
26 | 27 |