FishElite 500C and SeaCharter 500CDF
Copyright 2004 LEI-Eagle All rights reserved
Table of Contents
Sonar Troubleshooting Basic GPS Operations
Basic GPS Quick Reference 104
Advanced GPS Operations 125
System & GPS Setup Options 139
Searching 169
Supplemental Material 185
Page
Read Me First
How this manual can get you out on the road, fast
For the water with your unit
Sonar
General
Back-up memory
Audible alarms
Position updates
Automatic ranging
Auto bottom track
Graphic symbols for Waypoints or event
How Eagle Sonar Works
How GPS Works
Page
Introduction to GPS and Waas
Page
Emulator
Free Training Aids Available
Sonar Viewer
How to use this manual typographical conventions
Menu Commands
Arrow Keys
Keyboard
Instructions = Menu Sequences
Page
Page
Transducer Installation
Preparations
Selecting a Transducer Location
How low should you go?
Pad Deadrise less than Strakes
Transducer centerline Hull bottom
Shoot-Thru-Hull vs. Transom Mounting
Transom
Dot
Transom Transducer Assembly and Mounting
Assembling the bracket
Transducer bracket RatchetRatchet
Aligning the transducer on the transom
Alignment letters Positions Transducer
Ratchets
Bolt
Nut
Flat washer
Assembling the transducer
Drilling mounting holes
Attaching transducer to transom
Metal Nut Washer Rubber
Bottom Hull Flat-bottom hull Deep-vee hull
Ing the boat if it is knocked off at high speed
Internal tooth washer TMB-S bracket Bolt Nut Flat washer
Transducer Orientation and Fish Arches
Partial fish arches
Transducer aimed
Too far back
Hulls With Flotation Materials
Testing Determines Best Location
Shoot-Thru-Hull Preparation
Transducer location High speed Trolling speed
Shoot-Thru-Hull Installation
Speed/Temperature Sensors
Optional Speed Sensor Installation
Good location
Transom Bottom of hull
Power Connections
Bracket Installation
Mounting the Unit Bracket, In-Dash or Portable
Front
In-Dash Installation
173.9 72.9 23.4 137.9 Millimeter 56.9 Inch
Millimeters Inches
Portable Installation
146.5
GPS Antenna/Receiver Module Installation
Cell battery
Nmea Cable Connections
MMC or SD Card Memory Card Installation
Nmea Wiring
Other Accessories
To remove an MMC
To add an MMC or SD Card
Thumb ScrewInsert card face up, this way
Switch Boxes
MMC slot access door
Keyboard
Power/lights on and off
Main Menu
Main Menu
Pages
Satellite Status
Navigation
Map
Sonar
Page
Digital data Surface signal
Basic Sonar Quick Reference
Sonar Operations
To adjust sensitivity
Fish Symbols vs. Full Sonar Chart
To Restore Factory Settings
ASP Advanced Signal Processing
To change the ASP level
Alarms
Depth Alarms
Zone Alarm
Fish Alarm
To turn the fish alarm on
Press ↓ to Fish Alarmentexitexitexit
Sonar ALARMSENT↓ to Fish Alarmentexitexitexit
Calibrate Speed
Chart Speed
To adjust the ColorLine level
ColorLine
Thin or no ColorLine Wider ColorLine
Customize Page Displays
To change the information displayed in a data box
Depth Cursor
Depth Range Automatic
Cursor line Depth box
To switch to Manual Depth Range
Depth Range Manual
FasTrack
To turn Auto Depth Range on again
Fish I.D. Fish Symbols & Depths
Bar graph
To turn on FishTrack
To turn the Fish I.D. feature on
FishTrack
Frequency Change Transducer Frequency SeaCharter 500CDF only
Symbols with FishTrack depths
Log Sonar Chart Data
To change the frequency setting to 50 kHz
To change the frequency setting to 200 kHz
HyperScroll
Overlay Data
To record or log chart data
Noise Rejection
To overlay information on your screen
To remove overlaid data
To move overlaid data
To change displayed data font size
Steering arrow
Ping Speed & HyperScroll
To turn off HyperScroll
Reset Options
To change Ping Speed
Reset Water Distance
Set Keel Offset
Sensitivity & Auto Sensitivity
Automatic Sensitivity
To turn Auto Sensitivity back on
To adjust sensitivity in auto mode
To adjust sensitivity in manual mode
Sonar Chart Mode
Sonar Page & Sonar Chart Display Options
To change the chart mode color scheme
Full Sonar Chart
Split Zoom Sonar Chart
Digital Data
Customizing the Digital Data Screen
Tip
Sonar Simulator
Map With Sonar Split Screen
Title bar with chart file name Play symbol flashing
Stop Chart
Press MENUMENU↓ to Browse MMC Filesentent
To adjust the Surface Clarity level
Surface Clarity
Zoom & Zoom Bar
Surface clutter
Zoom Pan
Unit wont turn on
Unit freezes, locks up, or operates erratically
No fish arches when the Fish I.D. feature is off
Noise
Page
Page
Section Basic GPS Operations
Power/lights on and off
Main Menu
Pages Menu, showing some Map display options
Page
Navigation
Page
Map
Page
Background map vs. MapCreate map content
Minor Interstate Major Street Cursor line Streets
Pop-up
Marker School POI Restaurant
Zoom Range Position, distance Bearing data
Resize Window command
Page
Basic GPS Quick Reference
Find Your Current Position
Moving Around the Map Zoom & Cursor Arrow Keys
Cursor line Pop-up name box Selected wreck
Selecting Any Map Item With the Cursor
Searching
107
Page
Create Waypoint at Current Position
Set a Waypoint
To create and save a Waypoint
Create Waypoint by Entering a Position
Step
Create Waypoint on Map
Navigate To a Waypoint
Set Man Overboard MOB Waypoint
Navigate Back to MOB Waypoint
Navigate to Cursor Position on Map
Page
To Save a Trail
Navigate to a Point of Interest
Creating and Saving a Trail
Visible Active Symbol
Press ↓ to the Active Trail NameENT
Displaying a Saved Trail
Navigating Trails
To turn off trail display
To turn on trail display
Visual Trailing
Navigate a Trail forward
Page
Red course
Navigate a Back Trail backtrack, or reverse
Present position arrow North Magenta trail line Trail point
GPS Data files
Transfer Custom Maps and GPS Data Files
Custom Maps
122
Cancel Navigation
124
Find Distance From Current Position To Another Location
Find Distance From Point to Point
Create Icon at Current Position
Icons
Create Icon on Map
Delete an Icon
Navigate to an Icon
Routes
Create and Save a Route
PC-created Routes
Routes Created in the Unit
Page
Page
Edit Route Waypoints
Delete a Route
Edit a Route Name
Navigate a Route
Navigate a Route in Reverse
Trails
Delete a Trail
Trail NameENT↓ to
Edit a Trail Name
Edit a Trail Color
Edit a Trail Pattern
Utilities
Waypoints
Edit a Waypoint
Selecting a Waypoint
Waypoint Name
Waypoint Position
Set a Waypoint by Average Position
Set a Waypoint by Projecting a Position
Section System & GPS Setup Options
Press MENUMENU↓ to Alarmsentent
Communications Port Configuration
Check MMC Files and Storage Space
Configure Nmea
Press MENUMENU↓ to GPS Setupent
Coordinate System Selection
To setup Loran TD
To configure a map fix
Map Fix
GPS Simulator
Customize Satellite Status
Customize Navigation
Customize Map
To get to the GPS Simulator
Simulating Trail or Route Navigation
Hide GPS Features
Press MENUMENU↓ to GPS Setupentent
Initialize GPS
Map Auto Zoom
Pop-up Map Information
Map Data
Show Map Data
Map Overlays Range Rings Lat/Long Grid
Map Boundaries
Fill Water With White
Map Detail Category Selection
Press MENUMENU↓ to GPS SETUPENT↓ to Datum Selectionent
Map Datum Selection
Map Orientation
Track Up mode, map shows N and arrow to indicate north
Navionics Charts
To display a Navionics chart
To view Port Services information
Port Information
Port Services icons Pop-up name box Cursor lines
Tidal Current Information
To view Tidal Current information
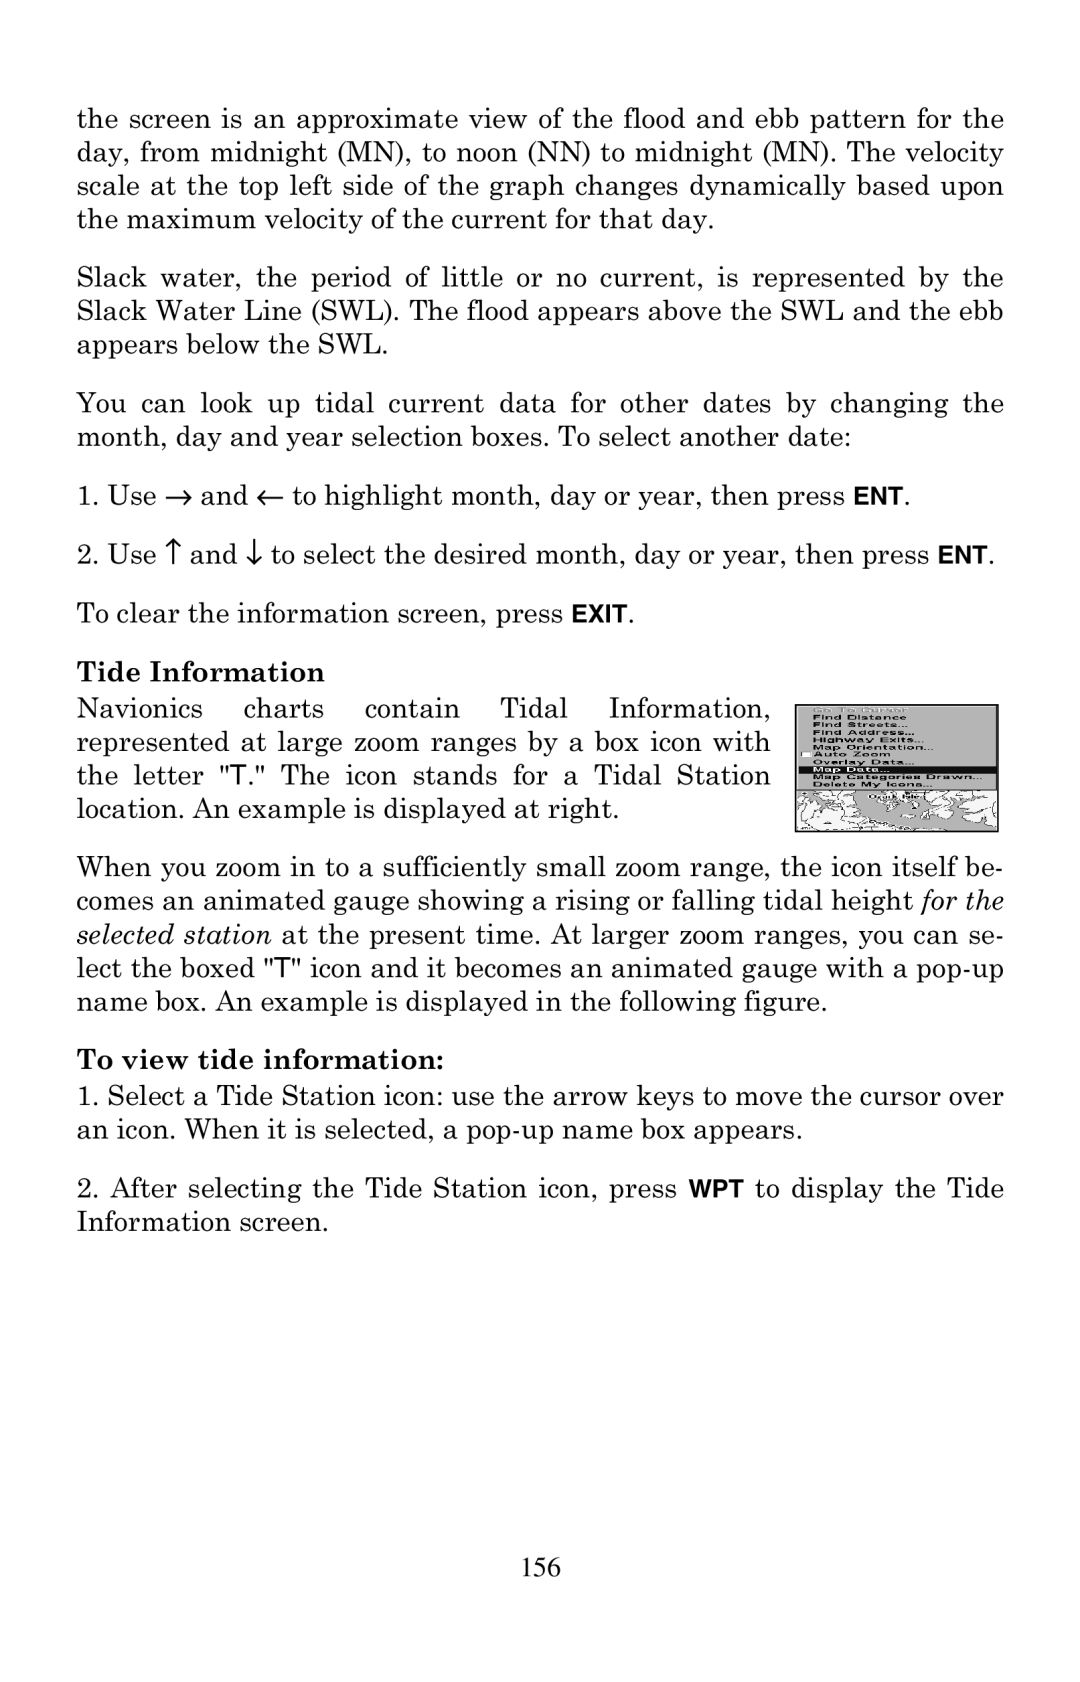
Tide Information
To view tide information
Pop-up name box Cursor line Tide Station icon
Pop-up Help
Screen Contrast and Brightness
Press MENUMENU↓ to GPS SETUPENT↓ to Require Waasent
Require Waas
Set Language
Set Local Time
Show Waas Alarm
Press MENUMENU↓ to GPS SETUPENT↓ to Show Waas Alarm
Sounds and Alarm Sound Styles
Software Version Information
Track Smoothing
Update Trail Option
Trail Options
Delete All Trails
General Trail Options
165
Transparency
Delete Trail
New Trail
Trail Visible/Invisible and Other Trail Options
Units of Measure
To adjust Menu Transparency level
Press MENUMENU↓ to System Setupentent
168
Searching
Find Addresses
171
Tip
Find Any Item Selected by Map Cursor
Find Interstate Highway Exits
174
Find Exit menu, with an exit selected in the list
Find Map Places or Points of Interest POI
Find by Name option, left, Find by Name menu, right
Find Streets or Intersections
Find a Street
ENT
Find an Intersection
Map Page showing results of an intersection search
Find Waypoints
Page
Page
Supplemental Material Datums Used by This Unit
186
187
188
FCC Compliance
190
Eagle Databases License Agreement
Databases Limited Warranty
Eagle Electronics Full ONE-YEAR Warranty
How to Obtain Service…
Not toll-free
Accessory Ordering Information for all countries
Visit our web site