Hp 12c platinum financial calculator
Printing History
About This Handbook
Introduction
Introduction
For More Solutions to Financial Problems
Financial Calculations in the United Kingdom
Contents
Section
Contents
Part II Programming 103
Part III Solutions 155
227
Appendix E Formulas Used 250
267
Making Financial Calculations Easy
14.00
48.00
500.00
21,396.61
42.03
10,371.79
168.00
11,024.82
Part Problem Solving
Getting Started
Power On and Off
Low-Power Indication
Adjusting the Display Contrast
Negative Numbers
Getting Started
Keying in Numbers
Digit Separators
123.63
Keying in Large Numbers
7814
Backspacing
Keys Clears
KeystrokesDisplay ALG mode
63+
Clear Keys
Example
RPN mode ALG mode
Undo Operation
RPN and ALG Keys
13.00
Simple Arithmetic Calculations in RPN Mode
Keystrokes RPN mode Display
Simple Arithmetic Calculations in ALG Mode
35.38
Chain Calculations in RPN Mode
Keystrokes RPN mode
22.95
10.14 1053+
42.00
30.00
Parentheses Calculations
Chain Calculations in ALG Mode
Storing and Recalling Numbers
Keystrokes ALG mode 8zgØ5 1gÙ Display
Storage Registers
500?2
Later that same day … Keystrokes Display RPN mode
250.00
Keystrokes Display 1250?0
58.33
Clearing Storage Registers
Storage Register Arithmetic
064.54
13.70
10.14
053.00
300
Percentages in RPN Mode
Percentage and Calendar Functions
Percentage Functions
Percentage and Calendar Functions
Percentages in ALG Mode
22,673.40
860.00
21,390.00
283.40
53.25
Keystrokes ALG mode Display
Percent Difference
58.50
29.69
Percent of Total in RPN Mode
Percent of Total in ALG Mode
Date Format
Calendar Functions
Future or Past Dates
11,09,2004
14.05
491.00
Number of Days Between Dates
11.09
498.00
Displaying Numbers in the Financial Registers
Basic Financial Functions
Financial Registers
Storing Numbers into the Financial Registers
Clearing the Financial Registers
Simple Interest Calculations
Basic Financial Functions
455.18
60.00
450.00
455.25
Financial Calculations and the Cash Flow Diagram
Basic Financial Functions
Cash Flow Sign Convention
Payment Mode
Generalized Cash Flow Diagrams
Basic Financial Functions
Calculating the Number of Payments or Compounding Periods
Compound Interest Calculations
325.00
Sets the payment mode to End
35,000.00 Stores PV
143.11
328.00
27.33
181.89
Recalls payment amount
327.00
141.87
466.87
Stores FV
GÂ n Keystrokes ALG mode
775.00
50.00
4000
58.00
29.00
50.00 977.27
10,000.00 Stores FV
Keystrokes Display ALG mode 4000
22.73
Calculating the Periodic and Annual Interest Rates
Calculating the Present Value
Keystrokes RPN mode Keystrokes ALG mode
9gC 450ÞP 1500+
369,494.09
12.00
17,500.00
540,000.00
243,400.00 Stores PV
Calculating the Future Value
200.00
60,000.00
717.44
222,975.98 Amount of balloon payment
Sets payment mode to End
5gA
243400$ 243,400.00 1363.29ÞP -1,363.29
28,346.96
24.00
281.34
32,000.00
Odd-Period Calculations
Basic Financial Functions
5gC
012004
135.17
Z30+
§12
950.00
120.00
GÒ z30+
Basic Financial Functions
Keystrokes Display FCLEAR G Enters 25 gC 250000 $
Amortization
250,000.00
238.26
498.12
970.91
245,029.09
380.51
093.75
404.37
360.00
Discounted Cash Flow Analysis NPV and IRR
Additional Financial Functions
Calculating Net Present Value NPV
Additional Financial Functions
Negative cash flow
212.18
130,000.00
Year Cash Flow
10,000.00
79,000.00
14,000.00
11,000.00
13.72
Calculating Internal Rate of Return IRR
Reviewing Cash Flow Entries
Changing Cash Flow Entries
100,000.00 500.00 14,000.00 79,000.00
857.21
644.75
120.38
Bond Calculations
Bond Price
042018
Total price, including accrued
Bond Yield
122.13
2f#
Depreciation Calculations
400.00
1f#
3f#
440.00
660.00
Continuous Memory
Additional Operating Features
Number Display Formats
Additional Operating Features
Status Indicators
Display
Scientific Notation Display Format
14.8746 14.9 14.87456320
1487456320
487456
Special Displays
Key in RPN Mode
Arithmetic Calculations With Constants
429,000.00
Recovering From Errors in Digit Entry
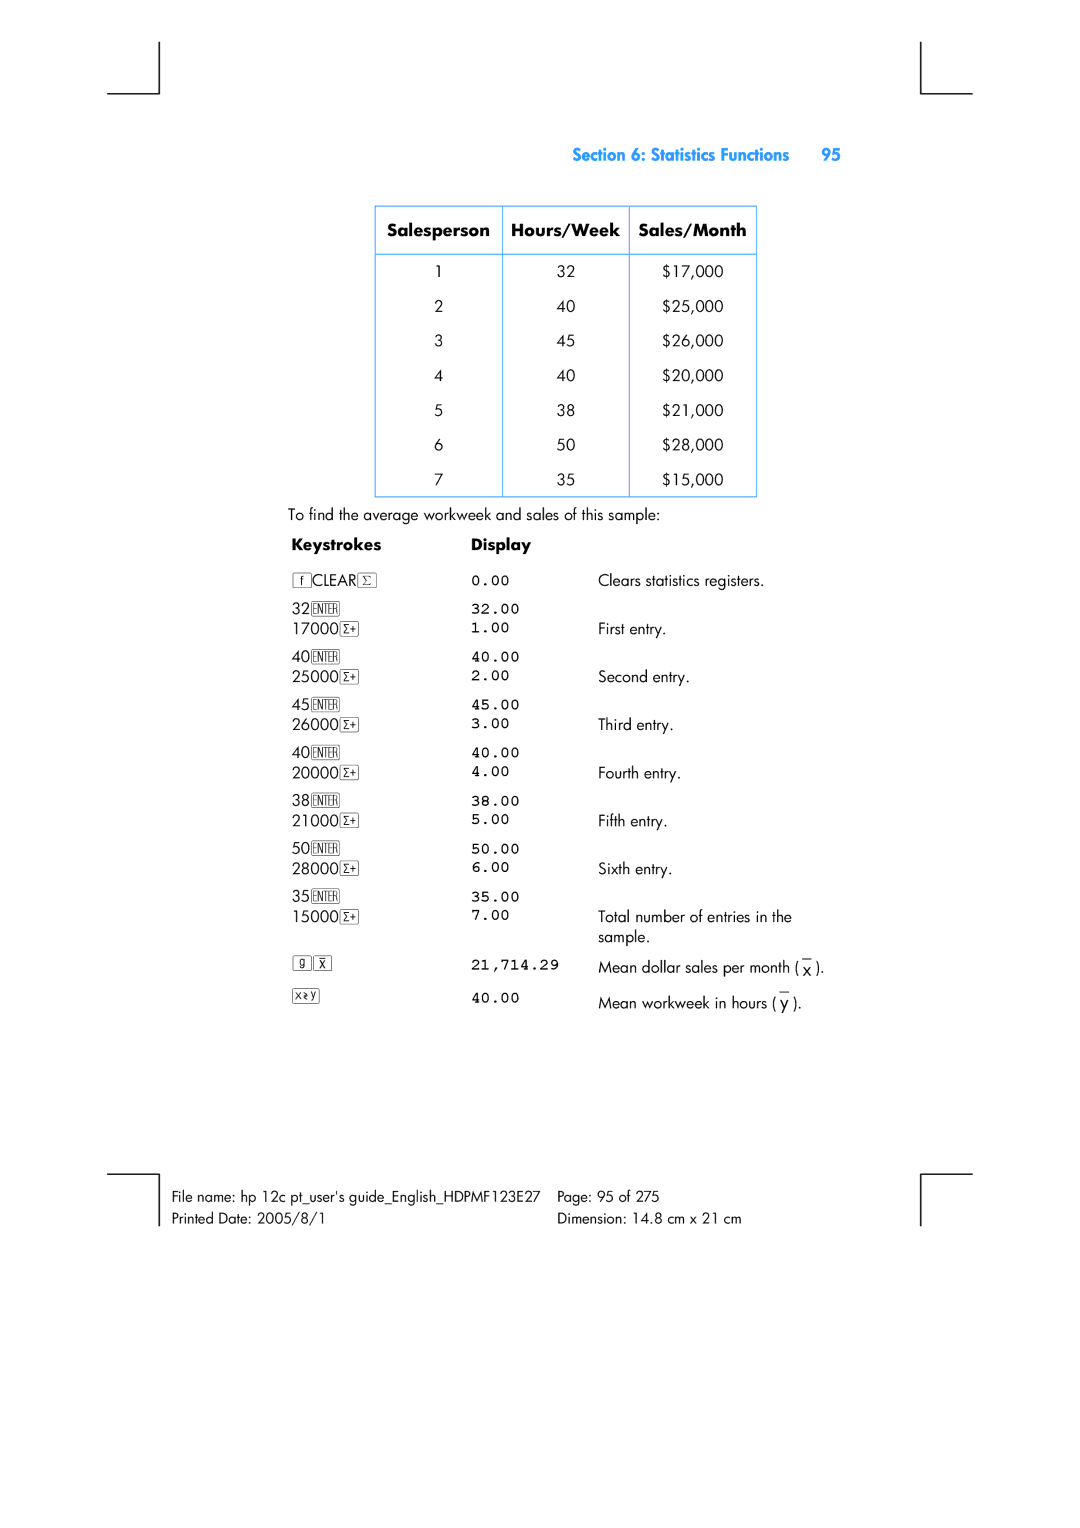
Accumulating Statistics
Statistics Functions
Register Statistic
Correcting Accumulated Statistics
Mean
Statistics Functions
35.00
32.00
40.00
38.00
463.00
Standard Deviation
820.59
Estimated sales for a 48 hour
Linear Estimation
28,818.93
Keystrokes Display 48 gQ
GR~d~
Keystrokes RPN mode 0gR Display
Keystrokes ALG mode 0gR 1gR~d-~ Display
001
Weighted Mean
100
Mathematics Number-Alteration Functions
One-Number Functions
3880000000
Mathematics and Number-Alteration Functions
258
Keystrokes To CalculateDisplay ALG mode
Power Function in RPN Mode
Power Function in ALG Mode
Part Programming
104
Why Use Programs?
Programming Basics
Creating a Program
155.00
Programming Basics
200
150.00
001 002 003 004 005 006 007
Running a Program
124.25
625
473.75
159
Identifying Instructions in Program Lines
Program Memory
Instruction Keycode
Nnn Nnn, 44
Nnn,43,33,000
Displaying Program Lines
Program memory
Mode and displays current line
Pressing gÜdoes the reverse Keystrokes Display RPN mode
Sets calculator to Program
Keystrokes Display 008,43,33,000 Program line
Expanding Program Memory
000 Instruction and Program Line
Programming Basics
Executing a Program One Line at a Time
Setting the Calculator to a Particular Program Line
Program line 006
Program line 002
Program line 003
Program line 004 b
Program line 005 +
Interrupting Program Execution
Pausing During Program Execution
68.5
?+1 ?+2 ?+3
Keystrokes RPN mode ?+1 ?+2 ?+3 Keystrokes ALG mode
119
001 002 003 004
001 002
004 005 006
008
60.11
012, 44 40
950.61
890.50
003,44 004 005 006
402.82
370.52
Stopping Program Execution
FCLEAR² 13\68.5 18\72.9 24\85
Fourth item
125
Branching and Looping
Simple Branching
Branching and Looping
Looping
782.47
007,43,33,002
150,000.00
188.72 007,43,33,002
593.75
593.75 005
188.72
190.22
Conditional Branching
592.25
Branching and Looping
Recalls test value into X-register
Stores income into register R9
004,43,33,007
006,43,33,008
20,000.00
006,43,33,009
008,43,33,010
010
20,000
15,000.00
15,000.00 004,43,33,007
15,000.00 007
25,000.00 005
20,000.00 007
25,000
25,000.00
15,000.00 009
15,000
15,000.00 005
15,000.00 006,43,33,009
Line 009
012,43,33,000 Line 012 gi000 000.00
005, 43 34 Line 005 go 20,000.00
20,000.00 009
25.00 010
25,000.00 007
139
Program Editing
Changing the Instruction in a Program Line
Program Editing
Keystrokes RPN mode Keystrokes ALG mode Fs gi.006 Display
Adding Instructions at the End of a Program
014
12,000.00
012
013
Adding Instructions within a Program
Adding Instructions by Replacement
Fs 15000t
Adding Instructions by Branching
016
Gi.010
Keystrokes RPN mode Fs gi.000
001,43,33,012
011,43,33,000
017,43,33,002
012 013
014 015,43,33,000 016
020 021,43,33,000 022
017,43,33,000
018 019
Program Editing
149
Multiple Programs
Storing Another Program
027,43,33,019
018,43,33,000
019 020 021 022
023 024 025 026
033,43,33,025
025 026 027 028
029 030 031 032
038 039 040,43 33,035
028 029 030 031
032 033 034,43,33,029
034 035 036 037
Running Another Program
Page
Part Solutions
156
Real Estate and Lending
Annual Percentage Rate Calculations With Fees
156,800.00
Real Estate and Lending
160,000.00
908.46
156,050.00
159,250.00
72.00
Keystrokes Display RPN mode ALG mode 12§ §12³
Keystrokes Display RPN mode ALG mode FCLEARG
Price of a Mortgage Traded at a Discount or Premium
657.97
137.17
777.61
312.00
300,000.00
Yield of a Mortgage Traded at a Discount or Premium
252.00
210.00
096.57
12.11
Rent or Buy Decision
258,377.24
18.00
008 009 010 011 012 013 014 015 016 017 018 019 020 021
000 001 002 003 004,44 005 006 007
RPN mode
Registers
Real Estate and Lending
270,000.00
165.00
700.00
900.00
15,218.35
Keystrokes Display RPN mode ALG mode Yield
Deferred Annuities
46,048.61
12,831.75
600.00
750.00
000 001 002 003 004 005 006 007 008 009 010 011
Investment Analysis
Partial-Year Depreciation
Straight-Line Depreciation
033,44
012 013 014 015 016 017 018 019 020 021 022 023 024
025,43 026 027 028 029 030 031
032,44
037,43,33
036 037 038 039 040
041,43,33
036,44
Investment Analysis
118,333.33
125,000.00
666.67
123,333.33
000 001 002 003 004 005 006 007 008 009
730.00
504.75
Declining-Balance Depreciation
029,44
010 011 012 013 014 015 016 017 018 019 020
021,43 022 023 024 025 026 027
028,44
034 035 036 037 038 039 040
034 035 036
50,000.00
Sum-of-the-Years-Digits Depreciation
11,458.33
035 036 037 038 039 040
018 019 020 021 022 023 024
025,43,33
026 027 028 029 030 031
042 043 044
25n
Keystrokes Display RPN mode ALG mode FCLEARG 12000$
500M
Full- and Partial-Year Depreciation with Crossover
?-0
008 009 010 011
008 009 010 011 012 013 014
041,44 042
032,43,33
033 034 035 036 037 038 039
040,44
064,43,33
057,43,33
058 059 060 061 062
063,44
094,43,33
080,44 081 082 083 084
085,43,33
086 087 088 089 090 091 092 093
Keystrokes Display RPN mode ALG mode FCLEAR H 11000 $
804.69
375.00
125.00
406.25
531.25
Excess Depreciation
10,500.00
312.50
Modified Internal Rate of Return
775,797.83
Group # of Months Cash Flow $
200,000.00
657,152.37
Black-Scholes Formula for Valuing European Options
Keystrokes Display
Keystrokes Display
075,44 076 077 078
065 066 067 068 069 070
071,43,33,077
073,44 074
089,44 090
089 090 091
092,44 093 094 095
096,44 097 098 099
Program Instructions
199
113 114,44 115 116 117
118,43,33
71.15
52.00
20.54
14.22
20.00
10.00
202
Leasing
Advance Payments
Solving for Payment
000 001
Leasing
11.64
64.45
008 009 010 011 012 013 014 015 016 017 018 019
008 009 010 011 012 013 014 015 016 017
66.86
65.43
600 P
Solving for Yield
57.00
23,200.00
Percentage
17.33
002 003 004 005 006 007 008 009 010 011 012 013 014 015 016
Annual yield as a
? t
Keystrokes ALG mode
017,45,43
19.48
Advance Payments With Residual
018 019 020 021 022 023 024 025 026 027 028 029 030
520.81
15.00
22,000.00
487.29
18.10
710.00
34.00
213
Keystrokes Display RPN mode ALG mode FCLEARG 25\ 25z 4nz¼
Savings
Nominal Rate Converted to Effective Rate
002 003 004 005 006 007 008 009 010
Savings
002 003 004 005 006 007 008
³ÞM¼
Effective Rate Converted to Nominal Rate
35 +Þ +5.35 ³Þ
Keystrokes Display RPN mode ALG mode FCLEAR G N100 $
Continuous Rate Converted to Effective Rate
105.35
217
Bonds
30/360 Day Basis Bonds
001 002 003 004 005 006 007 008 009 010 011 012 013
014 015 016 017 018 019 020 021 022 023 024 025 026 027 028
014 015 016 017 018 019 020 021 022 023 024 025 026 027
029 030 031 032 033 034 035 036 037
038,43,33
041 042 043 044 045 046 047 048 049
039 040 041 042 043 044 045 046
Bonds 219
040,43,33
102.55
104.74
103.41
Annual Coupon Bonds
223
20 ?0
94.75
12.01
Page
Appendices
228
RPN and the Stack
Appendix a RPN and the Stack
Getting Numbers Into the Stack The Key
Key
Rearranging Numbers in the Stack
Termination of Digit Entry
Stack Lift
Mathematics Functions
One-Number Functions and the Stack
Two-Number Functions and the Stack
Percentage Functions
Register
Calendar and Financial Functions
Last X Register and the Key
+ 5 6 +
Arithmetic Calculations with Constants
672,000.00
84,000
168,000.00
336,000.00
237
Algebraic Mode ALG
532.50
Appendix B Algebraic Mode ALG
Keying in Negative Numbers
18.5 §
Key in ALG Mode
History Stack in ALG Mode
400.43 737.07
8zgØ
1250+7b
Percent of Total
Power Function
To Calculate Keystrokes Display ALG mode
243
More About L
Appendix C More About L
245
Error Conditions
Error 0 Mathematics
Error 4 Memory
Error 1 Storage Register Overflow
Error 2 Statistics
Error 3 IRR
OperationCondition
Error 5 Compound Interest
Operation Condition
Error 6 Storage Registers
Error 7 IRR
Pr Error
Error 8 Calendar
Error 9 Service
Simple Interest
Formulas Used
Percentage
Interest
Compound Interest
Appendix E Formulas Used
Calendar
Discounted Cash Flow Analysis
200
Bonds
Depreciation
DPN J
Continuous Compounding
Interest Rate Conversions
Finite Compounding
Standard Deviation
Weighted Mean
Statistics
Linear Estimation
Rent or Buy Decision
259
Battery, Warranty, Service Information
Battery
Low-Power Indication
Installing a New Battery
Appendix F Battery, Warranty, and Service Information
Verifying Proper Operation Self-Tests
Appendix F Battery, Warranty, and Service Information
Warranty
Service
USA
Regulatory Information
Japan
Temperature Specifications
Noise Declaration
Canada
267
United Kingdom Calculations
Mortgages
Appendix G United Kingdom Calculations
Annual Percentage Rate APR Calculations
269
Statistics
Function Key Index
Financial
Stack Rearrangement
Modes
Mathematics
Number Alteration
272
Pressed from Keyboard
Run Mode Active Keys
Programming Key Index
274
Subject Index
Subject Index
Subject Index
Subject Index
Subject Index