Hp 17bII+ Financial Calculator
Printing History
Edition June January
Welcome to the hp 17bII+
Welcome to the hp17bII+
Contents
Error Messages
Using Parentheses in Calculations
Power Function Exponentiation
Saving and Reusing Numbers
Time Value of Money
Interest Rate Conversions
Cash Flow Calculations
Bonds
Depreciation
10 121 Running Total and Statistics
11 141 Time, Appointments, and Date Arithmetic
12 153 The Equation Solver
14 190 Additional Examples
Assistance, Batteries, Memory, and Service
More About Calculations
Menu Maps RPN Summary
RPN The Stack
RPN Selected Examples Error Messages Index
List of Examples
List of Examples
General Business Calculations
Currency Exchange Calculations
Interest Rate Conversions
Time, Alarms, and Date Arithmetic
How to Use the Equation Solver
Bonds and Notes
Running Total and Statistical Calculations
Important Information
Important Information
Power On and Off Continuous Memory
Adjusting the Display Contrast
Getting Started
Getting Started
Setting the Language
What You See in the Display
Keys for language Key Description
18 1 Getting Started
Shift Key @
Backspacing and Clearing
Keys for Clearing
Keys Display Description
20 1 Getting Started
Doing Arithmetic
Keys DisplayDescription
Using the Menu Keys
Keying in Negative Numbers
22 1 Getting Started
Main Menu
Menu Labels Menu Keys
Main Menu Menu Label Operations Done Covered This Category
24 1 Getting Started
Choosing Menus and Reading Menu Maps
Using the MU%C menu
26 1 Getting Started
Displaying the MU%C menu
Calculations Using Menus
Exiting Menus e
Clearing Values in Menus
28 1 Getting Started
Solving Your Own Equations Solve
= Cost
Typing Words and Characters the ALPHAbetic Menu
30 1 Getting Started
Editing ALPHAbetic Text
Keys
Characters
Calculating the Answer Calc
Alphabetic Editing Operation Label or Key to Press
Keyboard
32 1 Getting Started
KeysDisplayDescription
Controlling the Display Format
Decimal Places
Internal Precision
Temporarily SHOWing ALL
Rounding a Number
Exchanging Periods and Commas in Numbers
Error Messages
Modes
36 1 Getting Started
Double Space. Press
Calculator Memory @M
Number of bytes Percentage of total Memory still free
Arithmetic
Calculator Line
VDoing Calculations
38 2 Arithmetic
VUsing Parentheses in Calculations
Keys Display
Arithmetic
VThe Percent Key
Mathematical Functions
40 2 Arithmetic
VThe Power Function Exponentiation
Shifted Math Functions
Key
Math Menu
Math Menu Labels
42 2 Arithmetic
Description
Saving and Reusing Numbers
History Stack of Numbers
VReusing the Last Result @L
VKeys Display
44 2 Arithmetic
Storing and Recalling Numbers
VKeys Display Description
Keys New Register Contents
Doing Arithmetic Inside Registers and Variables
Arithmetic in Registers
Scientific Notation
Range of Numbers
48 2 Arithmetic
Percentage Calculations Business
Business Percentages BUS Menus Description
Using the BUS Menus
Examples Using the BUS Menus
Percent Change %CHG
50 3 Percentage Calculations in Business
Percent of Total %TOTL
Markup as a Percent of Cost MU%C
Markup as a Percent of Price MU%P
52 3 Percentage Calculations in Business
Sharing Variables Between Menus
Currency Exchange Calculations
Currx Menu
54 4 Currency Exchange Calculation
Selecting a Set of Currencies
Currx Menu
Currency Exchange Calculation
Menu Key
Currencies
United States Conversion Chart in US$
Entering a Rate
Currency Rate
Select CAN$ as currency
58 4 Currency Exchange Calculation
Select HK$ as currency
Converting Between Two Currencies
Storing and Recalling Sets of Currencies
Example Converting between Hong Kong and U.S Dollars
Clearing the Currency Variables
60 4 Currency Exchange Calculation
Time Value of Money
TVM Menu
Time Value of Money
First Level of TVM
Second Level of TVM
TVM Menu Labels
First Level
Second Level
Shortcut for N Multiplies the number in the display by
Cash Flow Diagrams and Signs of Numbers
64 5 Time Value of Money
FV is
Using the TVM Menu
66 5 Time Value of Money
Loan Calculations
68 5 Time Value of Money
Figures and stores number
@c
70 5 Time Value of Money
Figures and stores
Savings Calculations
000
72 5 Time Value of Money
Figures and stores number
Leasing Calculations
74 5 Time Value of Money
76 5 Time Value of Money
Amortization Amrt
Displaying an Amortization Schedule
Amrt Menu Labels
Label
78 5 Time Value of Money
Time Value of Money
80 5 Time Value of Money
Next successive set of payments authorized
First year
Printing an Amortization Table Table
82 5 Time Value of Money
Calculates and prints
Interest Rate Conversions
84 6 Interest Rate Conversions
Icnv Menu
Converting Interest Rates
Interest Rate Conversions
86 6 Interest Rate Conversions
Compounding Periods Different from Payment Periods
88 6 Interest Rate Conversions
90 6 Interest Rate Conversions
Cash Flow Calculations
Cflo menu
Cash Flow Calculations
Cflo Menu Labels
92 7 Cash Flow Calculations
Cash Flows Ungrouped
Creating a Cash-Flow List
94 7 Cash Flow Calculations
Entering Cash Flows
For grouped cash flows The display now shows
Prompting for #TIMES #T?. When the calculator displays
96 7 Cash Flow Calculations
Viewing and Correcting the List
Display Description
Copying a Number from a List to the Calculator Line
Naming and Renaming a Cash-Flow List
98 7 Cash Flow Calculations
Deleting Cash Flows from List. Pressing
Clearing a Cash-Flow List and Its Name
Starting or GETting Another List
Viewing the Name of the Current List. Press , then e
Cash-Flow Calculations IRR, NPV, NUS, NFV
100 7 Cash Flow Calculations
Calc Menu for Cflo Lists Menu Label
102 7 Cash Flow Calculations
Calculates NPV
Group Number Amount
104 7 Cash Flow Calculations
Prompts for next cash
106 7 Cash Flow Calculations
Doing Other Calculations with Cflo Data
Bonds
Bond Menu
108 8 Bonds
Bond Menu Labels
Menu Description Label
Bonds
Doing Bond Calculations
110 8 Bonds
To calculate the price or yield of a bond
Since there is no call on
112 8 Bonds
MM.DDYYYY format
Depreciation
Deprc Menu
114 9 Depreciation
Deprc Menu Labels
Depreciation
Doing Depreciation Calculations
DB, SOYD, and SL Methods
116 9 Depreciation
To calculate the depreciation for an asset
Basis Salv 4,000
Acrs Method
Year Percentage Deductible Keys Display Description
118 9 Depreciation
Partial-Year Depreciation
Calendar Year Depreciation Value
120 9 Depreciation
Running Total and Statistics
Running Total and Statistics
SUM Menu
SUM Menu Labels
122 10 Running Total and Statistics
Creating a SUM List
Entering Numbers and Viewing the Total
124 10 Running Total and Statistics
Date
Amount Date
Transaction
Naming and Renaming a SUM List
126 10 Running Total and Statistics
Clearing a SUM List and Its Name
Doing Statistical Calculations Calc
Calculations with One Variable
Calc Menu for SUM Lists Menu Key
128 10 Running Total and Statistics
Month Phone
Expense
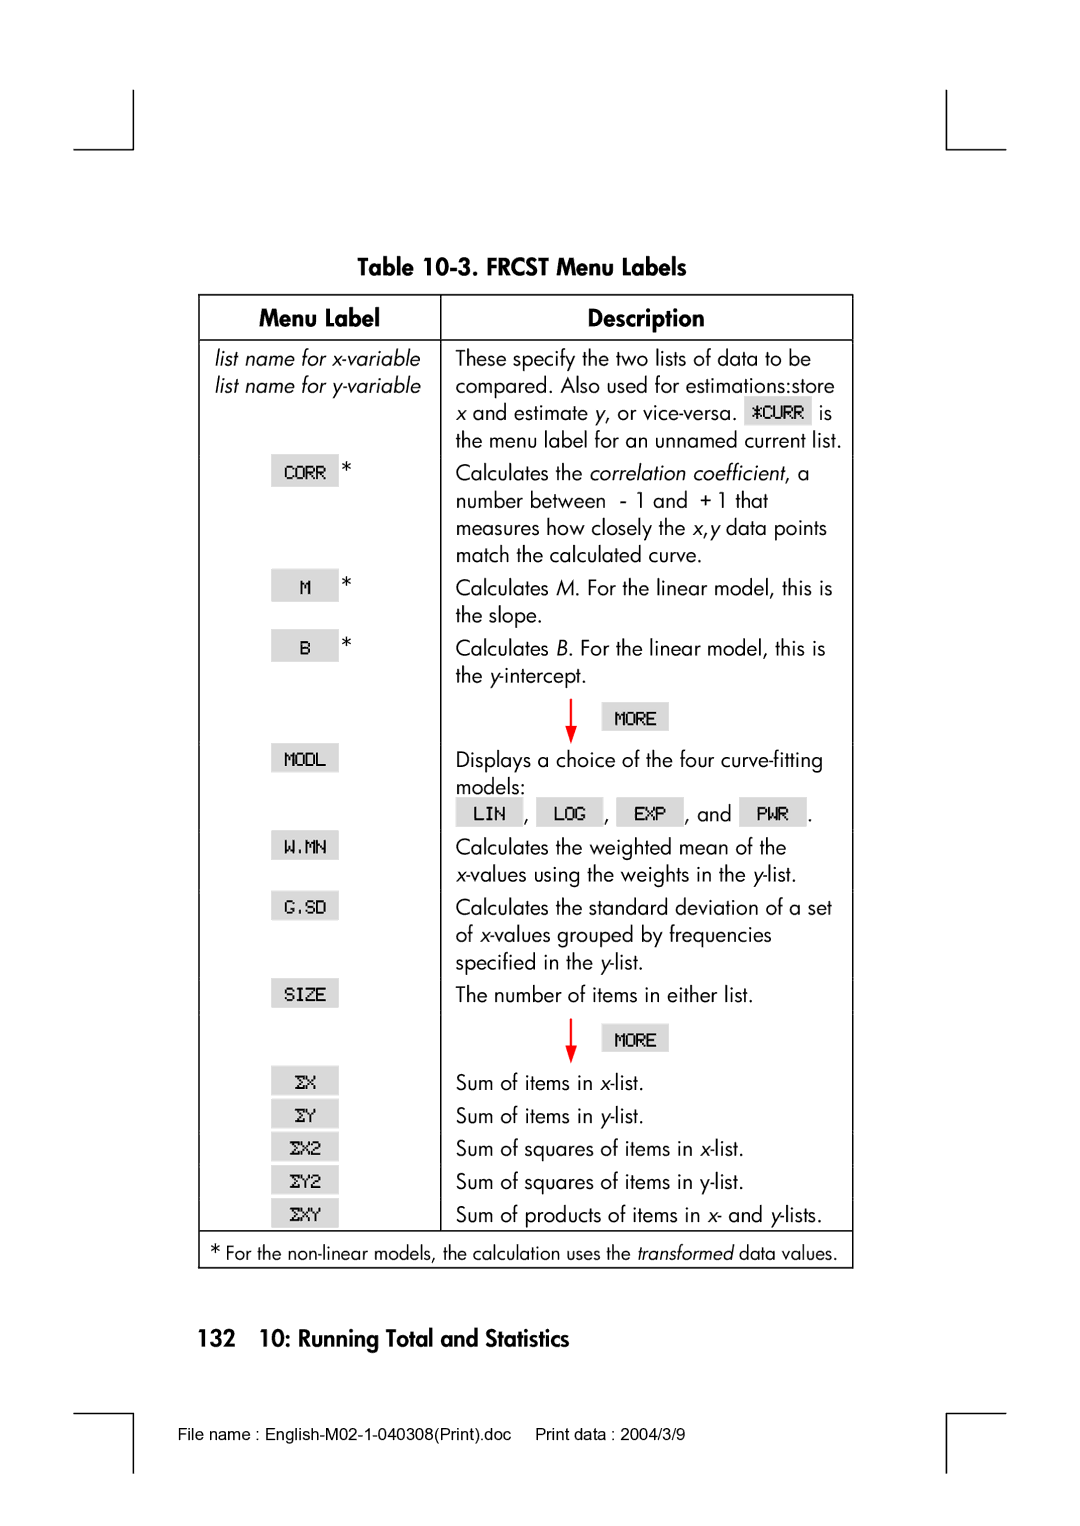
Calculations with Two Variables Frcst
130 10 Running Total and Statistics
Calc Total Mean Medn Stdev Range More MIN MAX Sort Frcst
Frcst Menu Labels
132 10 Running Total and Statistics
Curve Fitting and Forecasting
Logarithmic Curve Fit
134 10 Running Total and Statistics
To do curve fitting and forecasting
Number of Minutes Dollar Sales
Radio
Advertising Values
136 10 Running Total and Statistics
Minutes
Minutes
Weighted Mean and Grouped Standard Deviation
138 10 Running Total and Statistics
Summation Statistics
Rent
Doing Other Calculations with SUM Data
140 10 Running Total and Statistics
Time, Appointments, Date Arithmetic
Viewing the Time and Date
Time, Appointments, and Date Arithmetic
Time Menu
Time Menu Labels
142 11 Time, Appointments, and Date Arithmetic
Setting the Time and Date SET
SET Menu Labels
Menu Label Description
Or DD.MMYYYY
Adjusting the Clock Setting Adjst
Changing the Time and Date Formats SET
144 11 Time, Appointments, and Date Arithmetic
Viewing or Setting an Appointment APT1-APT10
Menu Labels for Setting Appointments Description
Appointments Appt
To set an appointment or view its current setting
146 11 Time, Appointments, and Date Arithmetic
Acknowledging an Appointment
Unacknowledged Appointments
Clearing Appointments
148 11 Time, Appointments, and Date Arithmetic
To acknowledge a past-due appointment
Date Arithmetic Calc
Determining the Day of the Week for Any Date
Calculating the Number of Days between Dates
Calc Menu Labels for Date Arithmetic
150 11 Time, Appointments, and Date Arithmetic
Calculating Past or Future Dates
152 11 Time, Appointments, and Date Arithmetic
DATE2
Equation Solver
Solver Example Sales Forecasts
Equation Solver
154 12 The Equation Solver
Next =OLD
Menu Label
Solve Menu
156 12 The Equation Solver
Keys
Entering Equations
Solve Menu Labels
To make an entry into the Solver list
Calculating Using Solver Menus Calc
To do a calculation using a Solver menu
158 12 The Equation Solver
Rmenu label
160 12 The Equation Solver
Eqty
Editing an Equation Edit
Naming an Equation
Finding an Equation in the Solver List
Shared Variables
Clearing Variables
162 12 The Equation Solver
Deleting Variables and Equations
Deleting a variable is quite different from clearing it
Writing Equations
Deleting One Equation or Its Variables Delet
Deleting All Equations or All Variables in the Solver @c
164 12 The Equation Solver
100
⋅ C
⋅ E
What Can Appear in an Equation
166 12 The Equation Solver
+ 5 ⋅ E
Using the Alpha Menu
Using a Typing Aid
Solver Functions
168 12 The Equation Solver
Solver Functions for Equations Description
DDAYSd1d2cal
170 12 The Equation Solver
HH.MMSS format
IFcond expr 1 expr
Svariable name
Cfr c 1 c 2 s expr
SIZECCFLO-listname
SIZESSUM-listname
#TCFLO-listnameflow#
172 12 The Equation Solver
Days
Conditional Expressions with if
OperatorKeys
≥ = ≤ = ≠ 174 12 The Equation Solver
Rating
Examples of Conditional Equations
VALUE=FIRST+1 ⎟ FIRST. If FIRST=0, then VALUE=FIRST
Percent Salary Increase
Summation Function ∑
176 12 The Equation Solver
Accessing Cflo and SUM Lists from the Solver
Creating Menus for Multiple Equations S Function
178 12 The Equation Solver
How the Solver Works
Halting and Restarting the Iterative Search
180 12 The Equation Solver
Entering Guesses
182 12 The Equation Solver
Printing
184 13 Printing
Printer’s Power Source
Double-Space Printing
Printing the DisplayP
Printing
Printing Other Information @p
Printing Variables, Lists, and Appointments List
Printer Menu Labels
186 13 Printing
Printing Descriptive Messages MSG
Trace Printing Trace
188 13 Printing
How to Interrupt the Printer
Keys Print-out
Additional Examples
Loans
Simple Annual Interest
190 14 Additional Examples
Yield of a Discounted or Premium Mortgage
Additional Examples
192 14 Additional Examples
Figures and stores total
Annual Percentage Rate for a Loan with Fees
See appendix F for RPN keystrokes for the next two examples
11.5
194 14 Additional Examples
@c e
Loan with an Odd Partial First Period
196 14 Additional Examples
Solver Equation for Odd-Period Calculations
Canadian Mortgages
198 14 Additional Examples
Solver Equation for Canadian Mortgages
Advance Payments Leasing
Solver Equation for Advance Payments
Savings
Value of a Fund with Regular Withdrawals
200 14 Additional Examples
Displays periodic
Deposits Needed for a Child’s College Account
202 14 Additional Examples
Additional Examples
Flow of Withdrawals
204 14 Additional Examples
For FLOW1
Value of a Tax-Free Account
206 14 Additional Examples
35
Value of a Taxable Retirement Account
208 14 Additional Examples
Modified Internal Rate of Return
210 14 Additional Examples
Group No. of Months Cash Flow, $ Flow no
V8 /12
180000
FLOW0
200000 I
V13 /12
212 14 Additional Examples
Price of an Insurance Policy
Solver Equation for Insurance Price
214 14 Additional Examples
Bonds
Discounted Notes
216 14 Additional Examples
Statistics
Moving Average
218 14 Additional Examples
Solver Equation for Moving Averages
Chi-Squared χ2 Statistics
Use
If necessary
220 14 Additional Examples
If the expected values vary
Keystroke Display Description
Number
Assistance, Batteries Memory, and Service
Assistance, Batteries, Memory, and Service
Answers to Common Questions
Obtaining Help in Operating the Calculator
Assistance, Batteries, Memory, and Service
Power and Batteries
Low-Power Indications
Do not use rechargeable batteries
Installing Batteries
Assistance, Batteries, Memory, and Service
Managing Calculator Memory
Resetting the Calculator
Reset hole
Erasing Continuous Memory
For English language
For the other languages
Determining If the Calculator Requires Service
Clock Accuracy
Environmental Limits
„ If the calculator won’t turn on
Assistance, Batteries, Memory, and Service
Confirming Calculator Operation Self-Test
Warranty
Assistance, Batteries, Memory, and Service
Service
Europe Country Telephone numbers
Asia Pacific Country Telephone numbers
America Country Telephone numbers
HP Invent
Regulatory information
Canada
Japan
More About Calculations
IRR% Calculations
Possible Outcomes of Calculating IRR%
More About Calculations
Halting and Restarting the IRR% Calculation
Storing a Guess for IRR%
Direct Solutions
Solver Calculations
O F I T = P R I C E - C O S T
S T = P R I C E - P R O F I T
E a = L x W
= a R E a ⎟ W
Iterative Solutions
More About Calculations
More About Calculations
More About Calculations
Equations Used by Built-in Menus
Actuarial Functions
Percentage Calculations in Business BUS
Time Value of Money TVM
Amortization
Interest Rate Conversions
Cash-Flow Calculations
NOM % P
NPV = CF0 + ∑CFj x Uspv i% nj x Sppv i% Nj
Bond Calculations
NUS = Uspv i% N Total = ∑nj ⋅ CFj
Depreciation Calculations
DB = Basis ⋅ Fact % /100
Sum and Statistics
Forecasting
Model Transformation
Equations Used in Chapter
SXY = Σ X
− M
SX 2 ⋅ SY
Odd-Period Calculations
Advance Payments
Modified Internal Rate of Return
Menu Maps
Menu Maps
Figure C-2. Currx Menu
Figure C-3. FIN Menu
Figure C-3 . FIN Menu
Figure C-4. SUM Menu
Figure C-5. Time Menu
Figure C-6. Solve Menu
RPN Summary
About RPN
About RPN on the hp 17bII+
RPN Summary
Setting RPN Mode
To select RPN mode Press @
Where the RPN Functions Are
Function Definition Key to Use Name
~ same as
Same as
Arithmetic Topics Affected by RPN Mode
Doing Calculations in RPN
Simple Arithmetic
↓. Except in Cflo and SUM lists, Efunction and the key also
27 %
To Calculate Press Display
RPN Mode ALG Mode
Calculations with STO and RCL
Chain Calculations-No Parentheses
To Calculate Press
Display
RPN The Stack
What the Stack Is
RPN The Stack
Reviewing the Stack Roll Down
Exchanging the X- and Y-Registers in the Stack
Arithmetic-How the Stack Does It
How Enter Works
Lost
Clearing Numbers
Reusing Numbers
Last X Register
Retrieving Numbers from Last
Chain Calculations
Solution 23 @w13 E9 *-7@t+
Exercises
RPN Selected Examples
RPN Selected Examples
KeysDisplay
Calculates annual interest
For E, press =, not
#TIMES1 for FLOW1
I11 I
Annual payment deposit
Error Messages
Error Messages
Error Messages
Error Messages
Error Messages
Index
Special Characters
Index
169
147
156
166
,
31-32
174-76
145
149
144
162-64
116
181-83
229
Examples
133
168-71
138-39
,
72-73
213-15
239
242-46
, 132 , 109 , 49, 53 , 52, 128 , 128 , 128 , 128
Memory. See also Continuous Memory
143-44
, 101 , 101 , 101 , 157 , 56 , 56 , 56 , 42
92-94
175
164-67
, 56 , 42 , 18 @p, 186 P
PMT. See also Payments in TVM, 63 rounded amortization
Repeating appointments past-due, 148 setting
Using
128
146-47
243-46
176
171
148
178
133-34
This regulation applies only to The Netherlands