| Cash Flows |
Table | |
|
|
Item | Description |
|
|
Inv. I% | Investment or discount rate. Enter the investment rate or discount rate for the cash |
| flow followed by I. |
|
|
Net PV | Net present value. Shows the value of the cash flows at the time of the initial cash |
| flow, discounting the future cash flows by the value set for Inv. I%. |
|
|
Net FV | Net future value. Shows the value of the cash flows at the time of the last cash flow, |
| discounting the earlier cash flows by the value set for Inv. I%. |
|
|
Net US | Net uniform series. Shows the |
| equivalent present value to the cash flow list. |
|
|
Payback | Payback. Shows the number of periods for the investment to return value. |
|
|
Discounted Payback | Discounted Payback. Shows the number of periods required for the investment to |
| return value if the cash flows are discounted using the value set in Inv. I%. |
|
|
Total | The sum of all the cash flows, equivalent to NPV if Inv. I% is 0. |
|
|
#CF/Yr | The number of cash flows per year. The default is 1. |
|
|
IRR% | Internal rate of return. This is the discount rate for the cash flow that returns a Net |
| Present Value of 0. |
|
|
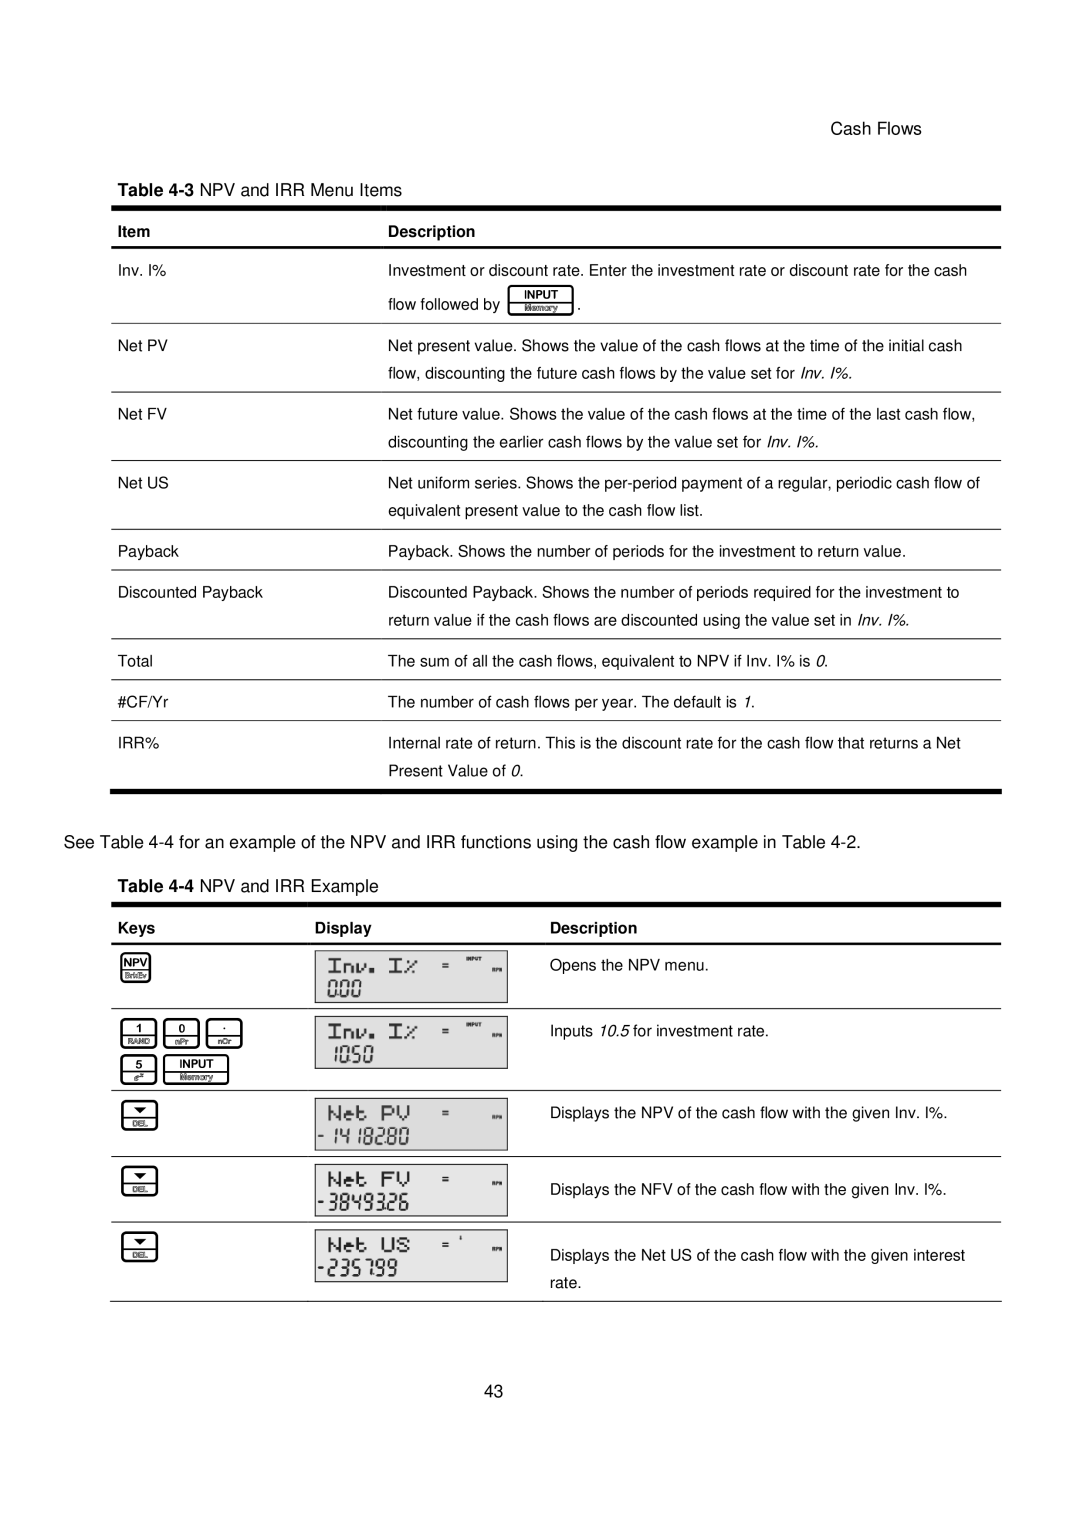
See Table
Table
Keys | Display | Description |
|
|
|
P
Opens the NPV menu.
10.
5I
Inputs 10.5 for investment rate.
<
<
<
Displays the NPV of the cash flow with the given Inv. I%.
Displays the NFV of the cash flow with the given Inv. I%.
Displays the Net US of the cash flow with the given interest rate.
43
