HP ProCurve Switch 212M and 224M
Page
Management and Configuration Guide
HP ProCurve Switch 212M and 224M
Publication Number
Contents
Rebooting the Switch Using the Command Prompt
Main Menu Features Screen Structure and Navigation
Overview
Rmon Extended Rmon
Trap Receivers
Monitoring and Analyzing Switch Operation
Unusual Network Activity
Troubleshooting Approaches
Vii
MAC Address Management
Page
Interface
Understanding Management Interfaces
Selecting a Management Interface
Advantages of Using the HP Web Browser Interface
Selecting a Management Interface
Example of the Switch Console Display
Advantages of Using the Switch Console
Example of HP TopTools Main Screen
HP TopTools for Hubs & Switches
Network Traffic
Page
Tion on
Configuring an IP Address on the Switch
Manually Configuring an IP Address
Methods for Configuring an IP Address and Subnet Mask
Configuring an IP Address on the Switch
Internet IP Service Screen
Where To Go From Here
Overview
Using the HP Web Browser Interface
HP Web Browser Interface
Web Browser Interface Requirements
Supported Network Devices and System Requirements
PCs
Enable Java and Enable JavaScript options
Using a Standalone Web Browser in a PC or Unix Workstation
Starting an HP Web Browser Interface Session
Enter
Using HP TopTools for Hubs & Switches
Status Overview Screen
Using
Viewing the First Time Install Window
Tasks for Your First HP Web Browser Interface Session
Using the HP Web Browser Interface
Device Passwords Window
Using the User Names
Using the Passwords
If You Lose a Password
If Online Help Fails to Operate. Do one of the following
Online Help for the HP Web Browser Interface
See also Support URLs Feature on
How To Access Web Browser Interface Online Help
Overview Window
Web Browser Interface Screen Layout
Using the HP Web Browser Interface
Port Utilization
Port Utilization and Status Displays
Changing the Graph Area Scale
Port Status
Alert Log
Each alert has the following fields of information
Sorting the Alert Log Entries
Alert Types
Respectively and the Event Log in the switch console
Alert Strings and Descriptions
Alert String Alert Description
10. Detail View of Alert Log Entry
Viewing Detail Views of Alert Log Entries
11. The Alert Control Bar
Alert Control Bar
Identity Tab
Tab Bar
Status Tab
14. The Configuration Tab and Buttons
Configuration Tab
Security Tab
Diagnostics Tab
Support Tab
Status Bar
Status Indicator Key
Color
18. The Fault Detection Window
Setting Fault Detection Policy
Working With Fault Detection
Using the Switch Console
Using the Switch Console
Session with the switch
How To Start a Console Session
Starting and Ending a Console Session
Press any key to continue
Protected logon process
How To End a Console Session
Main Menu manager mode
Main Menu Features
Using the Switch Console
Elements of the Screen Structure
Screen Structure and Navigation
TaskActions
How To Navigate in the Console
Example Showing How To Display Help
Level Actions Permitted
Using Password Security
Switch operates on the Operator level
To set Manager and Operator passwords
Is entered correctly, access to the console will be denied
From the Main Menu select
To set a new password
Rebooting the Switch
Using the Switch Console
Using the Command Prompt
Using HP TopTools To Monitor and Manage
Using HP TopTools To Monitor and Manage the Switch
HP Proprietary MIBs include
Snmp Management Features
Snmp Configuration Process
Extended Rmon
Advanced Management Rmon and HP Extended Rmon Support
Configuring the Switch
To find a specific feature, see the table on the next
Organized as follows
Configuring the Switch
Configuration Features
Support URL
Support/Management URLs Feature
Management Server URL
IP Configuration
Configuring IP Addressing on the Web Browser Interface
Configuring IP Address from the Web Browser Interface
IP Address
Parameter Description
To Access IP Addressing
Configuring IP Address from the Switch Console
From the Main Menu, select
Additional HP Proactive Networking Features
How IP Addressing Affects Switch Operation
Address Available with an IP Address and Subnet Mask
DHCP/Bootp Process
DHCP/Bootp Operation
Overview
Dhcp Operation
Bootp Operation
Where
Documentation for your Bootp server for more information
From the switch console Main Menu, select
Configuring DHCP/Bootp
Country
Globally Assigned IP Network Addresses
Company Name/Address
Snmp Communities
Configuring Snmp Communities from the Switch Console
To View, Edit, or Add Snmp Communities
Snmp Communities Screen Default Values
Addresses
Access Configuration menu
To move from one field to the next
Trap Receivers
Trap Receivers Configuration Screen Default Values
Event Level Description
Two parameters
Console/Serial Link
Console/Serial Link Configuration Screen Default Values
To Access Console/Serial Link Features
System Information
Configuring System Parameters from the Web Browser Interface
To Access System Information
Configuring System Information from the Console
Switch Configuration System Information
Port Settings Parameters
Port Settings
Flow Control Note
Configuring Port Parameters from the Web Browser Interface
To Access Port Configuration
Configuring Port Parameters from the Switch Console
Switch Configuration Port Settings
Configuring Port Monitoring from the Web Browser Interface
Network Monitoring Port Features
Not be copied to the monitor port
To Access Port Monitoring
Configuring Port Monitoring from the Switch Console
Switch Configuration Network Monitoring Port
Spanning Tree Protocol STP
Should set the Spanning Tree Enabled parameter to Yes
Redundant paths
Network
Enabling STP from the Web Browser Interface
This procedure enables or disables STP on the switch
To Access STP
Using the Switch Console To Configure STP
Switch Configuration Spanning Tree Operation
See How STP Operates on
How STP Operates
16. Example of Active and Backup Paths Between Two Nodes
Switch. Refer to IP Configuration on
To Changing the Querier Configuration Setting on
17. Configuring Igmp from the Web Browser Interface
Configuring Igmp from the Web Browser Interface
Using the console enables these additional options
Using the Switch Console To Configure Igmp
18. Example of the Igmp Service Screen
To Access Igmp Service
How Igmp Operates
Role of the Switch
Configuring
Switch
20. Isolating IP Multicast Traffic in a Network
Changing the Querier Configuration Setting
Special Case Igmp Configuration
Setmib hpSwitchIgmpQuerierState.1 -i
Getmib hpSwitchIgmpQuerierState.1
Switch Configuration
Page
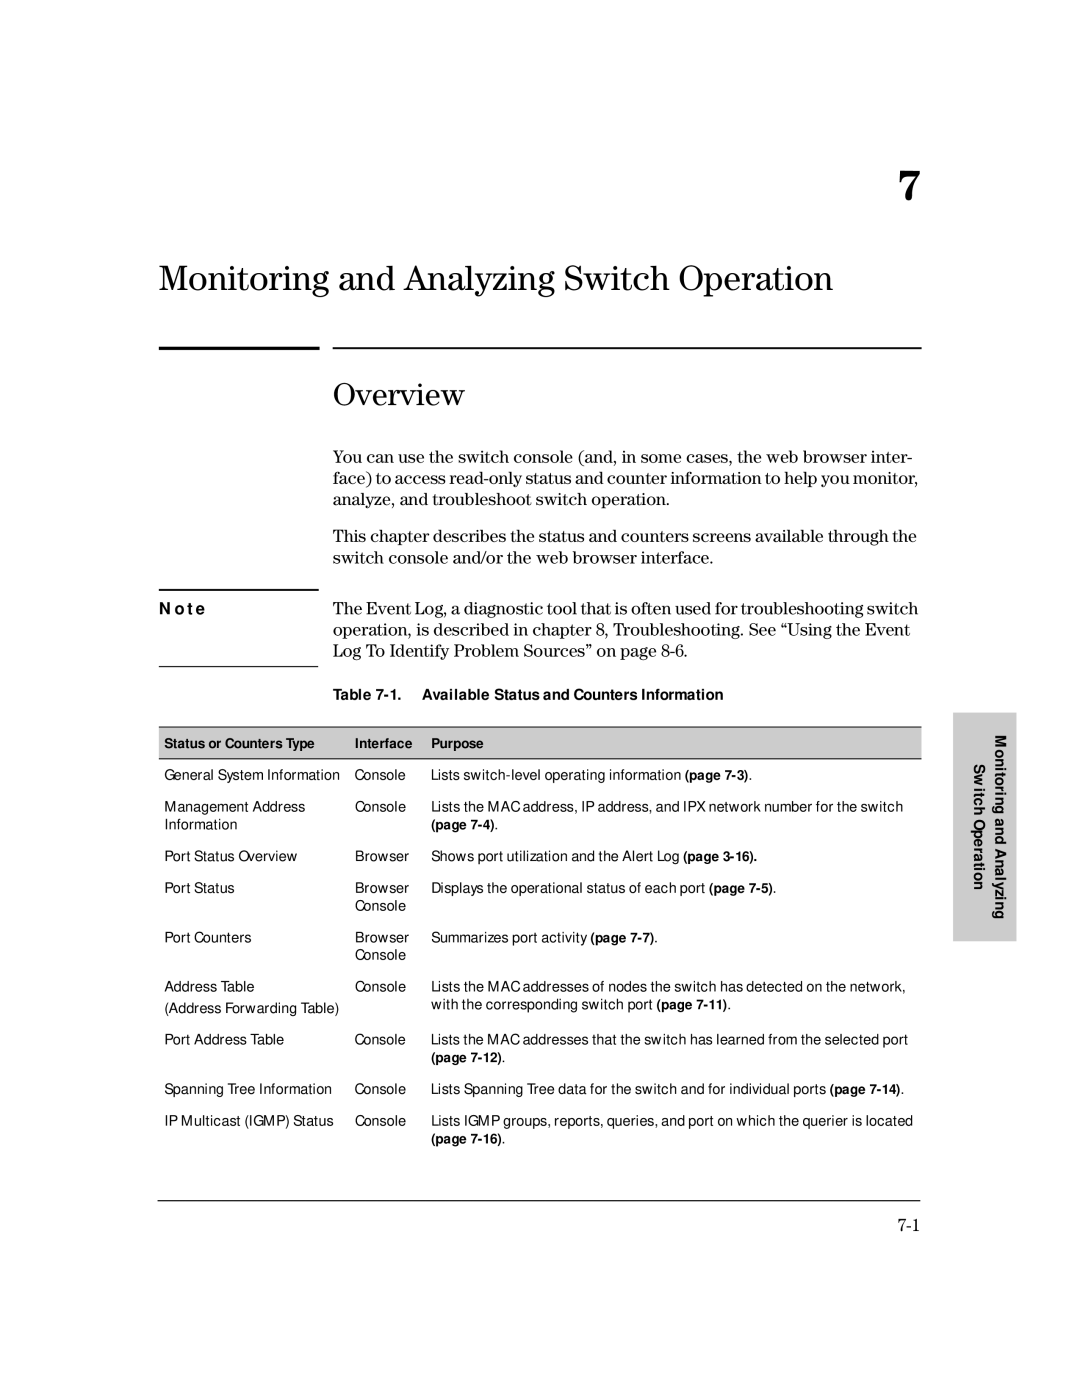
Available Status and Counters Information
Switch Operation
Status or Counters Type Interface Purpose
Monitoring Switch Monitoring and Analyzing Switch Operation
Switch Console Status and Counters Menu
Analyzing Operation
Status and Counters
General System Information
To access this screen from the console Main Menu, select
Status and Counters General System Information
To access this screen from the Main Menu, select
Switch Management Address Information
Status and Counters Switch Management Address Information
Displaying Port Status from the Web Browser Interface
Port Status
To access this screen from the Main Menu, click on
Displaying Port Status from the Switch Console
Monitoring Switch
Status and Counters Port Status Analyzing Operation
Port Counters
Switch Operation Monitoring and Analyzing
Analyzing
Displaying Port Counters from the Web Browser Interface
Status and Counters Port Counters
Displaying Port Counters from the Console Interface
Example of the Display for Show details on a Selected Port
Status and Counters Address Table
Address Table
Status and Counters Port Address Table Analyzing Operation
Port Address Table
11. Example of a Port Address Table for a Specific Port
Status and Counters Spanning Tree Information
Spanning Tree STP Information
Monitoring and Analyzing Switch Operation
14. Example of Igmp Status Screen
IP Multicast Igmp Status
Monitoring and Analyzing
Page
Troubleshooting
Troubleshooting
Troubleshooting
Troubleshooting Approaches
Web Browser Interface or Switch Console Access Problems
Unusual Network Activity
General Problems
Ip Invalid ARP source IP address on IP address
Checking for an IP Address on the Switch
IGMP-Related Problems
08/05/98 105232 Ports Port 1 enabled
Using the Event Log to Identify Problem Sources
Date Time System Module
Severity
System Description Module
Event Log System Modules
Key Action
Event Log Control Keys
Switch’s diagnostic tools include the following
Diagnostics
Feature Switch Console Web Browser Interface
Ping and Link Tests
Ping and Link Test Screen on the Web Browser Interface
Executing Ping or Link Tests from the Web Browser Interface
Diagnostics Link Test Ping Test
Executing Ping or Link Tests from the Switch Console
Linktest Command Timed out
Linktest Command Successful
Ping Failed or Target did not Respond Troubleshooting
If the Link test fails, you will see
Configuration File
Diagnostics Browse Configuration File
Browsing the Configuration File from the Switch Console
Type exit and press Enter to return to the Diagnostics Menu
Using the Command Prompt
List of Commands Available at the Command Prompt
Restoring the Factory Default Configuration
File Transfers
Press E for Edit
Using Tftp To Download the OS File
File Transfers
Example of the Download OS Screen During a Download
To Perform the OS Download
Using Xmodem to Download the OS File
Download OS
Switch-to-Switch Download
Using the SNMP-Based HP Download Manager
Select Method Tftp
Example of Message for Tftp Download Failure
Troubleshooting Tftp Downloads
Session in which the download was attempted
Diagnostics Menu and executing the History command
Diagnostics
Transferring Switch Configurations
Command Prompt
Put IPaddress Config remotefile
Diagnostics Command Prompt
Configuration. The switch then automatically reboots itself
Xput config remotefile pc/unix
Xget config remotefile pc/unix
MAC Address Management
Determining the MAC Addresses
Screen similar to figure B-1 is displayed
Base MAC Address
MAC Address Management
Walkmib ifPhysAddress
Switch Port MAC Addresses
Page
Index
Index
Index
Defaultconfig
MIB
Port, traffic patterns … 7-7 priority
STP
Tftp
Support information location … 6-3 support tab … Tab bar …
Page
Page
5967-2146